Design System

Section Gallery

Every reusable page section and the site chrome (nav + footer), rendered live by the real renderer from the actual page schemas — 58 variants in all. The atomic UI components (buttons, inputs, chips) live in the Component Gallery; this is their larger sibling. New templates and variants appear here automatically once a page uses them.

Site chrome (organisms)

SiteNavOrganism sticky-dark Site-wide sticky navigation header. Single source: site/site-chrome.json. from site-chrome.json Docs ↗
SiteFooterOrganism dark-columns Site-wide footer — nav reinforcement, legal, secondary CTAs. from site-chrome.json Docs ↗
Pete, founder of Wordnerds

So you're reading the footer now? Either you ❤️ Wordnerds or you're desperate for something to read. Either way, CX Corner from Wordnerds is the answer. Fortnightly Voice of Customer bombs dropped in your box. Signup 👇 or find out more.

Heroes & page openers

HeroTemplate centred Page-opening section — sets the frame in ≤8 seconds. On every page. from about.schema.json Docs ↗

Meet the nerds behind the words.

We're a Newcastle company on a slightly unusual mission: to make sure no organisation ever again sits on a mountain of customer feedback it can't actually use.

Wordnerds turns what customers say into what organisations do. We integrate AI-powered insight from surveys, complaints, reviews and calls directly into Power BI where decisions happen, so everyone in the organisation can act on what customers are saying, not just the insight team.

The Wordnerds team at Blencowe Hall
HeroTemplate dark-split Page-opening section — sets the frame in ≤8 seconds. On every page. from c-rating-playbook.schema.json Docs ↗

Social housing · consumer grading

Predict Your C Rating Playbook

Wordnerds read every published consumer-grading judgment to date—alongside 270 elements of tenant sentiment across 18 housing associations—to find what the Regulator of Social Housing actually rewards. The pattern is clear: C1 isn't won on headline repair stats. It's won on whether you can show you hear every tenant and act on what they tell you.

This playbook maps the four pillars the regulator keeps naming onto the data you already hold—so you can find your weakest pillar before an inspector does.

HeroTemplate dark-split-boxed Page-opening section — sets the frame in ≤8 seconds. On every page. from consultancy.schema.json Docs ↗

Turn your feedback into decisions—with a team of experts behind you.

AI can't be responsible for the outcomes. But you know who can? Our Nerd-assisted consultancy—behavioural scientists, statisticians and analysts working alongside your team, co-designing how your feedback is classified, training it to your sector, and turning it into decisions you can defend.

Wordnerds experts working alongside a customer team on their feedback framework
HeroTemplate dark-split-contained Page-opening section — sets the frame in ≤8 seconds. On every page. from pricing.schema.json Docs ↗

See what Wordnerds costs—and build the business case yourself.

Wordnerds turns what customers say into what organisations do. We integrate AI-powered insight from surveys, complaints, reviews and calls directly into Power BI where decisions happen — so everyone in the organisation can act on what customers are saying, not just the insight team.

Real prices are right below. Every plan includes setup, training, a UK success manager and Power BI dashboards—and pricing scales with how much feedback you analyse, not how many people log in.

A group of colleagues gathered around a glowing screen, looking astonished at what they see.
HeroTemplate dark-split-cutout Page-opening section — sets the frame in ≤8 seconds. On every page. from platform.schema.json Docs ↗

Put any feedback-analysis method to the test—starting with ours.

Point a general-purpose AI tool at raw customer feedback and you get answers that sound confident, change every time you ask, and trace back to nothing. Wordnerds takes a different route. This page walks through the architecture, the method, the team and the proof—so you can judge it for yourself.

Illustration of a strategic insight manager pausing in thought, a thought bubble above him asking whether this method is really better than using ChatGPT—and whether he could stand behind it
ProblemStatementTemplate text-left-quote-right The empathy moment — names the villain before the proof. from about.schema.json Docs ↗

How Wordnerds started

Wordnerds began with a December 2015 challenge from Nissan: out of thousands of tweets an hour, could you spot the one or two that hinted at a production-line fault? Pete Daykin pulled in linguist Steve Erdal, they combined brand-new AI with very old linguistics, won the pitch, and by 2017 had turned it into a company.

I'll be honest: it started as a half-arsed idea at a hackathon. In December 2015 my agency took on a 48-hour challenge set by Nissan: out of around 3,000 tweets an hour mentioning them, could we spot the one or two a day that hinted at a real production-line problem?

I was almost certainly the only person in the room without a data science team. So I phoned Steve, a freakishly tall Scottish linguist I'd met in a pub, who'd just identified the author of a Victorian ghost-story manuscript from its linguistic fingerprint. His insight was that language is surprising: people say their 'gearbox is toast' or their 'suspension is goosed', the kind of thing a keyword search would never catch. He sat up all night and wrote 21 rules to find exactly that.

We won. Nissan funded a proof of concept, word spread fast, and we started attracting the kind of global businesses a regional agency could never normally get near. Wordnerds was incorporated as a company in its own right in 2017, and over the stretch that followed I wound down the agency, Steve left his dusty library, and we went all in.

What's struck me most since is that the longer we do this, the more we realise the humans behind the tech matter more than the tech itself. We set out to build a software business that didn't need people. We were wrong, and we're glad we were.

ProblemStatementTemplate text-right-quote-left The empathy moment — names the villain before the proof. from consultancy.schema.json Docs ↗

Can't we just build this ourselves with AI?

You can get part of the way with an AI model and a BI tool—plenty of capable teams do. The gap is everything after the first draft: a classification you can trust at scale, the method to turn it into decisions, and the cost of keeping it all running. That's what a team of experts brings, and what building alone rarely reaches.

Generative AI has moved fast, and with the agentic future bearing down it can feel as though the expectation is to build everything in-house and treat outside help as a last resort. We'll declare our bias up front: we've spent more than ten years building software to understand customer feedback, so of course we think insight and CX teams get further working with Wordnerds than taking it on alone. But we've watched plenty of teams try the DIY route, and we know where it usually ends up.

An off-the-shelf LLM gives you top-level classification and sentiment, and for a quick look that can be enough. A mature voice-of-customer programme needs much more. Even the classification is harder than a demo suggests once real feedback arrives—sarcasm, regional dialect, the idioms specific to your industry, and the long tail of edge cases that off-the-shelf models routinely misread. Get that layer wrong and every number built on top of it inherits the error.

Explainers & content

FeaturePillarsTemplate 3-up Three or four parallel capabilities as visually equal pillars. from book-a-diagnostic.schema.json Docs ↗

Ways to work together

There's no single way in. Most teams use some blend of these, and we'll help you find the shape that fits.

  • Wordnerds running your Voice of Customer programme end to end

    Managed service

    Hand us the analysis. We run your Voice of Customer programme end to end and deliver the insight, so your team can get on with acting on it.

  • Wordnerds tackling a specific question with your team

    Consultancy

    Bring us in for a specific question or a one-off piece of work—a deep dive, a framework, a thorny dataset—and we'll help you crack it.

  • Running the Wordnerds platform yourself

    The platform

    Subscribe to the Wordnerds platform and run it yourself, with as much or as little of our help alongside as you want.

FeaturePillarsTemplate 4-up Three or four parallel capabilities as visually equal pillars. from c-rating-playbook.schema.json Docs ↗

The four Consumer Standards

Four Standards came into force on 1 April 2024 under the Social Housing (Regulation) Act 2023. Every consumer-grading inspection is built on them.

  • Safety and Quality

    Safe, decent, well-maintained homes and good-quality landlord services, with an accurate, up-to-date and evidenced understanding of stock condition. Stock-condition data quality is the single most-cited failure mode.

  • Transparency, Influence and Accountability

    Be open with tenants, treat them fairly, and let them shape and challenge services. This is where the Tenant Satisfaction Measures live—the most explicitly "voice of the tenant" Standard. (One Standard, not two—mind the Oxford comma.)

  • Neighbourhood and Community

    Work with tenants, other landlords and partner agencies to keep shared spaces safe and tackle anti-social behaviour, hate incidents and domestic abuse. Reports must be easy to make and progress communicated.

  • Tenancy

    Allocate and let homes fairly and transparently, offer appropriate tenancy types, support tenants to sustain their tenancy, prevent fraud, and run an accessible mutual-exchange service.

FeaturePillarsTemplate media-left Three or four parallel capabilities as visually equal pillars. from about.schema.json Docs ↗

What we value

Five things we actually try to live by, not a poster in the kitchen.

  • Learn, experiment & change

    We make decisions on data, not opinions (including about ourselves). We run the business on the same evidence-led habit we sell, and change our minds when the data says so.

  • Own your impact

    Everyone here connects their work to something that actually moves the company forward. Owning the outcome matters more than ticking off the task.

  • Move the metrics that matter

    Our quality bar sits well above "good enough". As Pete puts it, sevens kill start-ups. We aim past the seven.

  • Make a connection

    Every interaction with Wordnerds should feel warm and genuinely useful. It's why customers tell us the people are the best part of working with us.

  • Challenge because you care

    We disagree well. Nothing's hidden: we run open-book, and the best idea wins regardless of who it came from.

StepCardsTemplate 3-step The named plan — sequential, verb-led steps. from book-a-diagnostic.schema.json Docs ↗

What to expect

Pick your sector and book

Choose your sector, see who you'll meet, and grab a 30-minute slot that suits you.

A real discovery call

We'll dig into your feedback, your data and your goals, and what's getting in the way. Come as you are—there's nothing to prepare.

A clear next step

You'll leave knowing whether we can help and what a first engagement would involve—usually a focused diagnostic with a defined output.

StepCardsTemplate 4-step The named plan — sequential, verb-led steps. from consultancy.schema.json Docs ↗

How a consultancy project runs

A consultancy project is a one-off piece of commissioned work: you arrive with a specific problem—usually non-standard or complex, and outside the skill set of the people you have in-house. It's the work that calls for specialist analysis, data science, data engineering, behavioural science or deep voice-of-customer expertise. We agree the deliverables, costs and timescales up front, like any other piece of work—then we run it like this:

A Wordnerds expert and a customer team mapping the objective behind the project

Discovery

We start with the question behind the question—your objective, your sector, and the way your customers and teams actually talk. No two engagements start the same way, so we map what good looks like before we build anything.

Designing the engagement plan and a framework chosen for the customer's sector and goal

Project design

We design the engagement around that objective: the right frameworks and methodologies for your sector and goal, the channels in scope, and a delivery plan with clear, short iteration cycles. You know what you're getting, and when.

Rapid, AI-driven prototype iterations refined with the customer in short cycles

Agile delivery

Because our product and methods are AI-driven, we build a working prototype fast and refine it with you in short cycles—you see real output in days, steer it, and watch it sharpen, instead of waiting months for a big reveal.

Hardening the prototype for enterprise use with security and accuracy quality control

Hardening

Once you're happy it's genuinely useful, we make it robust for an enterprise: proper security review if it's a software tool, rigorous accuracy and quality control if it's a dashboard, report or one-off deliverable. The prototype becomes something you can stake decisions on.

StepCardsTemplate journey The named plan — sequential, verb-led steps. from about.schema.json Docs ↗

How we got here

No overnight success story, just a stubborn one. Here's the path from a hackathon idea to where we are now.

  1. Pete and Steve at the December 2015 Nissan challenge
    Dec 2015

    A half-arsed idea at a hackathon

    The 48-hour Nissan challenge that started it all: spot the rare car faults hiding in thousands of tweets. Pete and Steve's mix of brand-new AI and very old linguistics won the day.

  2. The Wordnerds leadership team
    2017

    Wordnerds becomes a company

    Nissan had funded a proof of concept and word was spreading. We incorporated Wordnerds as a company in its own right, and went all in: Pete winding down the agency, Steve leaving his dusty library behind.

  3. The early Wordnerds team, 2019
    The early years

    Finding our feet

    We won our first customers and grew fast, teaching computers to understand what people actually mean, not just the words they happen to use.

  4. The Wordnerds team in 2020
    2020

    The Grind

    Then COVID hit, and it hit our rail-sector customers especially hard. Almost overnight, the ground we'd gained started slipping, and we came close to the edge more than once.

  5. Wordnerds on stage at an industry event in Amsterdam, 2021
    The cockroach years

    We didn't die

    Someone once dubbed us a "cockroach startup", and the name stuck. We stayed disciplined with every pound, kept solving problems, and refused to go away, and the hard graft quietly forced a sturdier, better product.

  6. The Wordnerds team at the Proto office, 2024
    Aug 2024

    Built to last

    Growth followed the better product. In August 2024 we closed a £1.6m funding round to keep investing in the platform and the team, on our own terms, having proved we could survive without it.

  7. The Wordnerds team in 2025
    Today

    Where we are now

    A team of 23 across data science, engineering, product, customer success and more, working with organisations in UK regulated sectors who need insight they can actually trust and act on.

AlternatingWalkthroughTemplate 3-step Long-form explainer — alternating media/text rows. from platform.schema.json Docs ↗

Three phases, from raw feedback to live intelligence

Five layers is the architecture; three phases is how you build it with us. The whole point is to apply AI at the right layer—structured, classified data—instead of pointing it at raw feedback and hoping for the best.

01

Connect every feedback source

Wordnerds ingests every channel your customers actually use—surveys, complaints, contact-centre calls, reviews, social and in-product feedback—into one foundation. No sampling, no leaving the awkward channels out because they're hard to read. The alternative most teams live with is a spreadsheet per source and a manual copy-paste job that never quite finishes; a general-purpose AI tool pointed at a single export has the same blind spots. You finish this phase with every customer voice in one place, ready to be classified consistently.

Multiple customer feedback sources—surveys, complaints, social media and reviews—flowing automatically into the Wordnerds unified data pipeline
Automated NLP classification transforming unstructured customer feedback into structured, labelled, comparable themes via the Wordnerds five-step data pipeline
02

Build structured insight

This is where Wordnerds' automated classification does the heavy lifting: sector-tuned models read every comment and assign it against a structured taxonomy, at a scale and consistency no manual process can match. Your analysts then author and ratify that taxonomy, so the model runs against definitions you own and recognise. Point a general-purpose AI model at the same raw text and you get themes that shift on every run, with nothing to audit. You finish with structured, scored, comparable data—and a classification you can stand behind.

03

Deliver actionable intelligence

The structured intelligence pushes straight into Microsoft Power BI, where your teams already make decisions—and because Wordnerds builds once and serves both, the same foundation answers AI agents and chat tools in plain language. The output is built to be acted on, not admired: the priorities that matter, ranked by impact, each carrying the evidence behind it and a clear read on what to fix first. You finish with insight living where the work already happens, not in a report archived in a platform nobody opens.

The Wordnerds build-once-serve-both delivery: analysts receive a full Power BI dashboard view; operational teams and AI agents receive plain-language answers from the same semantic foundation
DiagramExplainerTemplate centered A process/architecture diagram as the section centrepiece. from c-rating-playbook.schema.json Docs ↗

What did the 13 May 2026 batch reveal?

Eight judgments in one day—four C1s, two C2s, one C3—sharpened three patterns: a converging "wide range of opportunities" phrase, self-referral proving compatible with C1, and culture without data falling short.

Regulatory judgement papers

Pattern 1 — the "wide range of opportunities" tell

The phrase appears across all four new C1 judgments; the regulator uses identical language because it is naming one observed pattern—multiple, mature, embedded channels for tenant influence rather than a single flagship mechanism.

Pattern 2 — self-referral pays

Stockport self-referred in December 2025 for overdue fire-safety actions; that fact sits inside its C1 judgment. BCP Council's January 2026 C1 followed a June 2024 self-referral. Transparency about weaknesses, paired with credible remediation, counts favourably.

Pattern 3 — culture without data isn't C1

London Borough of Islington was praised for "a fair and respectful culture towards tenants" and still received C3, citing surveys more than ten years old and 13% of homes with collected information. Culture is necessary but insufficient; the operational systems behind it must be present.

DiagramExplainerTemplate media-side A process/architecture diagram as the section centrepiece. from sectors-housing.schema.json Docs ↗

Does Wordnerds already speak housing—TSM and Awaab's Law?

Yes. Wordnerds ships a housing theme bank built to the TSM categories and the 29 Awaab's Law (HHSRS) hazards, ready from day one. Sector-tuned AI models detect the themes automatically; your team then refines the definitions in housing's own language—so the framework fits your stock, your services and your tenants, not a generic template.

The classification runs on trained models, not hand-coding and not a general-purpose chatbot. They read every comment, detect the housing themes and count them reliably. Definition-led co-design sits on top as the quality layer: your analysts shape what each theme means—what counts as damp and mould, what counts as a communication failure—so the output is both automated and genuinely yours.

The result is a framework a regulator recognises and a team can defend.

The Wordnerds housing theme bank, built to the TSM measures and the 29 Awaab's Law (HHSRS) hazards
The housing theme bank: pre-built to the TSM measures and the 29 HHSRS (Awaab's Law) hazards.
FrameworkLayersTemplate sticky-nav A layered framework or model, built up layer by layer. from c-rating-playbook.schema.json Docs ↗

The four pillars the regulator keeps naming

Read the published judgments side by side and four recurring noun phrases stand out, in near-identical language across very different organisations. These are observation, not invention—each pairs the regulator's verbatim language with the Wordnerds × Housemark sentiment evidence and a self-check.

Pillar 1

Data triangulation

The regulator grades whether you cross-reference multiple data sources against one another—not whether you hold data, report it, or even collect it. The verb is triangulating.

In practice at C1

Stockport (C1) has 1,300 tenants in regular consultations through a customer-voice membership group, alongside a complaints advisory panel—several listening surfaces read together. Hammersmith & Fulham (C1) runs a monthly complaints learning board alongside performance reported in both digital and non-digital formats.

Below C1

One C2 local-authority landlord collected information about tenants at sign-up that was "incomplete and not routinely updated". The pillar fails not because there's no data, but because what's there is stale and not joined up.

The sentiment evidence

In the Wordnerds × Housemark benchmark—270 customer-experience elements across 18 housing associations—when tenants self-mentioned mental-health challenges in their TSM free text, C1 organisations scored on average 10 sentiment points higher in how they handled the conversation. A vulnerability flag isn't enough: it must be event-stamped, time-varying, and joinable across ASB, repairs and complaints.

Self-check

Can you cut your TSM scores by recorded vulnerability flag? By tenure length? By stock condition? If the answer is no on any of those three, the regulator's triangulation question is sitting in front of you, unanswered.

"RSH is seeing evidence through inspections of landlords using and triangulating all of their data to pre-empt issues, facilitate challenge and continuously improve."

— Regulator of Social Housing
Pillar 2

Root cause resolution

Across the C1 judgments the regulator returns to one verb: learn. Not "we logged the complaint", not even "we resolved it"—but "we found the root cause linking a cluster of complaints, and did something about it".

In practice at C1

At Curo (a C1 organisation), Ed Bramall's team found that aggregating complaints up to a "repairs" category hid the work—most complaints are always about repairs. The useful unit was finer: plumbing versus electrical, timeliness versus communication. Each cluster had a different root cause, and unlocked a different action.

Below C1

The Housing Ombudsman's damp-and-mould Spotlight made the failure mode explicit: landlords treating damp as a resident problem when it was a building problem. In the Awaab Ishak case, staff attributed mould to the family's bathing and cooking habits; the landlord later admitted it "got that wrong".

The sentiment evidence

In the benchmark, C1 organisations' resolution language clusters around the type of issue—plumbing leak, electrical safety, communication—not around blame for the customer. C2s and C3s show more sentiment around explanation and pushback. Across thousands of complaints, that's the difference between solving a problem and handling a complaint.

Self-check

When complaints cluster, do you trace them to a root cause, or close the ticket? If the latter, you have a complaints process. You don't yet have a learning process.

"Learning from complaints is systematically captured, shared with tenants through the website and other customer communications, and used to drive service improvements."

— Regulator of Social Housing, Stockport C1 judgment
Pillar 3

Omni-channel listening

C1s have both formal and informal channels—the regular survey, the official complaint and the scrutiny panel, plus the chat with a housing officer and the line added to a repair note. Listening across channels means listening across surfaces, digital and non-digital.

In practice at C1

Stockport's 1,300-tenant customer-voice group is one channel; its complaints advisory panel another; its website-published learning a third; its TSM survey a fourth. The verdict wasn't "Stockport has a survey"—it was that Stockport has several connected ways for tenants to be heard.

Below C1

One C2 landlord posted 99% routine and 96% emergency repairs on time—well above sector norms. The regulator didn't penalise the metrics; it penalised the listening architecture: "most of these opportunities have only been developed over the past 12 months and need to be further developed". Maturity is graded, not just presence.

The sentiment evidence

Our analysis revealed a cascade: when digital-navigation sentiment was high—customers could find what they needed when they needed it—they were more likely to feel informed; and when they felt informed, they were more likely to trust the landlord. Trust is a leading indicator: it moves before satisfaction does.

Self-check

How many tenant-feedback channels are you actively reading, beyond TSM and complaints? If the answer is fewer than three, you're listening through a narrow channel.

"A range of formal and informal ways in which tenants influence the organisation."

— Regulator of Social Housing, Places for People C1 judgment
Pillar 4

Evidence-based action

Every C1 judgment references the closed loop: tenant feedback in, service change out, reported back to the tenants who fed it in. Without that closure, the first three pillars aren't enough.

In practice at C1

Curo's action tracker is just a SharePoint list—the system around it is what counts. Analysis identifies an issue; the team takes it to directors; actions are logged with owners and timescales; progress is reviewed; outcomes are reported into customer-feedback reports and board reports. The loop is closed by discipline, not by a platform.

Below C1

In one C2 judgment the regulator wrote that the landlord had "limited evidence of how it was using the information it holds to assess whether services deliver fair and equitable outcomes for tenants". The data exists; the action loop does not.

The sentiment evidence

Curo's data warehouse brought together customer, property, transactional and complaints data; the missing piece was the qualitative dimension—the words customers use. The complaints learning report, built with Wordnerds, sits on top of the warehouse and produces the categorised free-text analysis the action tracker consumes.

Self-check

How does a tenant who fed back six months ago find out what happened? If the answer is "they don't", your evidence-based action loop is open at the tenant-facing end.

"The views of tenants have influenced how it delivers services, and improved outcomes for tenants are clearly evidenced and reported."

— Regulator of Social Housing, Golden Lane Housing C1 judgment
IntegrationCalloutTemplate dark Integration/ecosystem hook (open data, Power BI). from awaabs-law.schema.json Docs ↗

About Wordnerds

Wordnerds builds an auditable structured data layer from customer feedback—surveys, complaints, reviews and calls. Analysts get the complete picture in Power BI; decision-makers ask questions in chat and get accurate, auditable answers quickly.

Wordnerds turns what customers say into what organisations do. We ingest feedback from surveys, complaints, reviews, calls and social; apply transparent, explainable AI to surface themes and drivers; and serve the insight two ways from one semantic model: full-detail Power BI for analysts, plain-language AI-chat answers for everyone else. Built for UK housing associations, transport operators and regulated sectors that need auditable evidence, not a black box.

Wordnerds
IntegrationCalloutTemplate dark-header-split Integration/ecosystem hook (open data, Power BI). from for-analysts.schema.json Docs ↗

If the AI gets it wrong, who's liable?

You stay accountable for the analysis, so Wordnerds makes it defensible. Automated, sector-tuned models theme every comment, and each theme traces back to the exact words behind it. The question was never "AI or not". It's which layer you apply AI at. Apply it to a structured model, and the output is auditable, not a guess.

Point a generic LLM at raw feedback and it guesses: it can't count reliably, can't show its sources, and draws the category lines differently every run. That's the black box you can't defend in a board meeting.

Wordnerds works one layer down. Trained models, tuned to your subjects rather than general-purpose, classify every comment consistently, and your analysts shape the definitions so the categories mean what your organisation needs them to mean. Quality control, on top of the automation. The result is insight you can audit: every theme traceable, every count real, the same category meaning the same thing in January and December.

That's what lets you show your working to leadership, the board, or a regulator, instead of asking them to trust a number you can't explain. (Want the full architecture? It's on the Software page.)

A theme tracing back to the individual comments it was built from, showing the audit trail behind the number
IntegrationCalloutTemplate light Integration/ecosystem hook (open data, Power BI). from consultancy.schema.json Docs ↗

It's AI and humans—working together

You decide what combination is right for you. Some clients bring in consultants to classify feedback at scale, others need help with intricate analysis, and others are happy to do it all themselves.

Some providers sell you software and wish you luck. Others do the analysis but lock it inside their own platform. Wordnerds joins the two: our experts design the method and shape the delivery, and the Wordnerds platform makes it repeatable—so the intelligence keeps flowing long after the first project, without anyone rebuilding it. For most customers the platform is the engine that does the actual processing; the consultancy is what points it at the right problem and makes the output land.

But it isn't all-or-nothing. Plenty of projects never touch a dashboard—a one-off analysis, a survey designed from scratch, a model built for a single decision. You take exactly as much of the platform as the job needs, and the same experts run it either way.

The Wordnerds team—the analysts, data scientists and behavioural scientists you'd work with on a consultancy project—together outside the office
IntegrationCalloutTemplate media-left Integration/ecosystem hook (open data, Power BI). from c-rating-playbook.schema.json Docs ↗
Predict Your C Rating self-assessment worksheet, page 1

The self-assessment worksheet

Sixteen items, four per pillar. Score each Yes / Partial / No, and note the data signal behind your answer.

Use it alone or with your team. After completion, tally your No and Partial responses by pillar: the pillar with the highest count is your largest gap; the pillar with the most Yes responses is your foundation.

It deliberately avoids producing a single score or predicting your C grade—the regulator doesn't grade in one number, and neither does this. The purpose is to locate the pillar with the largest gap, so you know where to start.

MediaTextSplitTemplate image-left A feature image beside a column of prose — the human/partnership moment. from platform.schema.json Docs ↗
The Wordnerds team of analysts who co-design and run customer-feedback frameworks
Meet the Nerds

A team of experts behind you, not just software

Wordnerds isn't only software. Our Nerd-assisted consultancy co-designs your classification framework, trains the models on your sector, and shapes the Power BI delivery around how your teams actually work. You can have it done with you or done for you—either way, the result is insight that fits your organisation from day one.

Behind every Wordnerds deployment is a team of analysts who do this for a living across housing, transport and other regulated sectors—people who have built feedback frameworks dozens of times before. They sit with your team to agree the themes that matter, bring sector frameworks that are already built, and tune the models to the language your customers and regulators use.

That co-design is the difference between a tool you have to learn and insight that's accurate and defensible from the first report. As your needs change—new channels, new regulatory questions, a board that wants something different—the same team keeps the framework current. It's a partnership, not a licence you're left to work out on your own.

OutcomesBandTemplate blue-panel A brand-blue "what you'll take away" panel — a tick-list of outcomes. from example (not yet on a live page) Docs ↗
What you’ll take away

By the end of this guide you’ll be able to

  • Read your regulator’s language back to them — and spot where your evidence falls short.
  • Prioritise the themes that move your rating, with the verbatim behind each one.
  • Turn a board-level narrative into a plan your frontline teams can act on.
  • Benchmark your position against peers without waiting for the next survey cycle.
VideoBandTemplate embedded A standalone marketing video band — privacy-friendly click-to-load YouTube facade. from sectors-travel-and-hospitality.schema.json Docs ↗

From drowning in feedback to acting on it

A few minutes on how travel and hospitality teams turn scattered guest feedback—reviews, surveys, social and calls—into decisions they can act on while the season's still running.

A few minutes, no sign-up required.
DemoBandTemplate storylane An interactive product-demo band — click-to-load Storylane walkthrough. from homepage.schema.json Docs ↗

See real outputs in five minutes

See how Wordnerds works. No form and no sales call. The guided demo runs in the browser.

Free and ungated. Click through real Power BI outputs at your own pace—no form, no sales call.

Routing & discovery

PathwayCardsTemplate 2-up Routes personas/segments to deeper pages. Each card is a CTA. from consultancy.schema.json Docs ↗
Beyond the platform

Expertise you can hire on its own

Yes—Wordnerds takes on one-off, commissioned consultancy projects, not just ongoing platform work. They're specialist pieces of analysis: bias-free survey design built to withstand legal challenge, behavioural-science studies, bespoke predictive models. We agree deliverables, costs and timescales up front, and the platform only comes in if the job needs it.

Some of the work never touches a dashboard—a survey designed from scratch, a model built for a single decision. Pure analytical and behavioural-science expertise, hired to answer one hard question. Two of the standalone projects we've taken on:

Public consultation that stands up to challenge

The North East Combined Authority brought us in to design the surveys behind a series of public consultations—decisions big enough to be challenged in court. We wrote questions free from leading bias, with a methodology built to hold up if anyone argued it was steering the result. And we worked with behavioural psychologists to understand what would actually change how people behave, not just what they say in the moment.

Predicting which customers are about to leave

For one of the UK's largest high-street banks, we built bespoke prediction models that read incoming complaints and flag the customers most likely to leave. It turns a backlog of grievances into an early-warning system the retention team can act on—reaching the customer before they walk, not reading about it after.

PathwayCardsTemplate 2-up-thumb Routes personas/segments to deeper pages. Each card is a CTA. from playbooks.schema.json Docs ↗

Browse the playbooks

Free self-audit frameworks, built from the regulator's own language and the Wordnerds × Housemark benchmark.

PathwayCardsTemplate 3-up Routes personas/segments to deeper pages. Each card is a CTA. from homepage.schema.json Docs ↗

Which describes you?

I'm a CX Analyst

Tired of manual coding and defending the methodology to the room? You'll find transparent AI, sector-tuned themes, and the time back to do the analysis you trained for.

I'm a CX Manager

You have the data; you need the decisions. You'll find the bridge from theme to action—drivers prioritised, evidence traced, dashboards your operational teams already use.

I lead CX transformation

You need customer evidence the board will trust and the regulator will accept. You'll find auditable themes, sector breadth, and a partner that scales with the transformation you're accountable for.

ResourcesRowTemplate 2-col Horizontal content-discovery row (latest blog, playbook, …). from c-rating-playbook.schema.json Docs ↗
ResourceCardsTemplate latest-mix The "useful resources" card band — build-injected latest content mix. from homepage.schema.json Docs ↗
PromoBandTemplate accent A single timely promotional callout — swappable per campaign. from c-rating-playbook.schema.json Docs ↗
The C Rating Report

Your Own C-Rating Report in 30 Days for £5,775

Dashboard, report and workshop, mapping your tenant feedback against the C1–C3 patterns from published judgments — roughly 30 days end to end. Register your interest and a housing specialist picks up the conversation within two working days.

PromoBandTemplate light A single timely promotional callout — swappable per campaign. from consultancy.schema.json Docs ↗

Two sides of Wordnerds

Software, a service—or both

You're looking at the consultancy—the team who run it with you or for you, including one-off projects. Prefer a platform your team runs day to day? That's the software—most customers use both.

Proof & social

ProofOutcomeTemplate text-left-aside-right Success vision + a named, numeric proof point. from about.schema.json Docs ↗

What we believe

We believe what customers tell you is one of the most valuable things a business owns, and most organisations waste it. Wordnerds exists to close that gap: we help CX and Insights teams turn what customers say into what their organisation actually does, with a forensic understanding of the feedback behind every decision.

Most organisations are sitting on more customer feedback than they could ever read, and acting on barely any of it. The insight gets stuck (in a platform, an inbox, a report nobody opens) while decisions get made on gut feel and the loudest voice in the room.

Our mission is to help CX and Insights teams create remarkable experiences through a forensic understanding of customer feedback. Not surface-level summaries: the granular, evidence-backed why behind what customers are telling you.

Where we're headed: organisations that understand their customers in real time, and use it to change what they offer, predict what's coming, and respond before they're asked. Everyone acting on the voice of the customer, not just the insight team.

ProofOutcomeTemplate text-right-aside-left Success vision + a named, numeric proof point. from consultancy.schema.json Docs ↗
Customer stories

From stranded with data to a team that gets asked what to do next

Sovereign Housing got around ten hours a week back—time their team had been spending wrangling feedback by hand—after Wordnerds built and ran their classification with them. The partnership turned a manual reporting chore into a live picture their operational teams could act on, not a report that landed late and went unread.

The pattern repeats across the teams we work with. Before, feedback piles up faster than anyone can read it, and the insight team spends its days re-packaging the same data for different audiences instead of finding what matters.

Dorchester Collection started with us running the analysis as a managed service while their team got up to speed, then took the reporting in-house as their confidence grew—the framework was theirs to own from the start, not rented. We stayed alongside for the harder questions.

That's the shift the partnership buys: not just cleaner data, but an insight team that stops defending its numbers and starts being asked, every week, what the business should do next.

It's the move from tagger to strategist: a CX team that runs on customer evidence, trusted to shape decisions rather than just report them.

StatBandTemplate 3-up A band of headline metrics — fast quantified proof. from customer-stories/avanti.schema.json Docs ↗
Key Metrics
1.3M Voices heard
7,102 Working days saved
£1.35M Labour cost savings
TestimonialPairTemplate 2-up Two real customer quotes side by side — a social-proof band. from about.schema.json Docs ↗

Why we love it here

Don't take our word for it. Take theirs.

"Not only great humans, but seriously intelligent and driven. You always feel listened to, valued, and encouraged to share ideas."

— Zoe Wilson, Senior Customer Success Manager

"Nothing's hidden: strategy, results, even the bank balance. That transparency makes it easy to trust the team and take ownership of what we do."

— Izzie Johnson, Product Manager

"We hold our own against some of the biggest, richest companies in the world by working together and thinking differently. We achieve things together that none of us could dream of doing alone."

— Steve Erdal, Chief Scientific Officer & co-founder

"This is genuinely the lushest, smartest and most passionate bunch of people you could ask for. I love problem-solving together and making lives easier."

— Lyndsay Stenhouse, Senior Customer Success Manager
PresentersTemplate grid Webinar presenter cards. Feeds Person[] JSON-LD. from about.schema.json Docs ↗

Meet the founders

Angela, Pete and Steve started it.

Angela Daykin

Angela Daykin

Chief Financial Officer

Pete Daykin

Pete Daykin

Chief Executive Officer

Steve Erdal

Steve Erdal

Chief Scientific Officer

Conversion

PricingTiersTemplate 3-up Priced subscription tiers. Emits Product + Offer JSON-LD. from consultancy.schema.json Docs ↗

What does a consultancy project cost?

Consultancy is priced by the value of the work, not by the hour—so every project is scoped with you up front. As a guide, engagements run from around £1,450 for a survey-design and framework review, to about £12,000 for a multi-month CX diagnosis and improvement programme. All prices exclude VAT.

Every engagement is different, so these are examples of the kinds of project we take on—and what they typically cost—rather than fixed packages. We scope yours with you, and price it on the value it delivers.

  • Programme design

    Design a VoC programme

    from £1,450

    Get the foundations right before you collect a thing.

    A focused design engagement

    • Review your survey design
    • Help you select analytical frameworks and methodologies
    • Shape a voice-of-customer programme that answers the questions you actually have
  • One-off analysis

    Analyse a dataset end-to-end

    around £7,750

    Turn a backlog of unstructured feedback into decisions.

    A one-off, full-stack analysis

    • Build categorisation models for your data
    • Analyse a large unstructured dataset
    • Build Power BI dashboards
    • Deliver a recommendations report
  • Outcome programme

    Diagnose & fix CX friction

    around £12,000

    Find your biggest friction points and move the metric.

    An outcome programme over 3–6 months

    • Diagnose your biggest CX issues and friction points
    • Implement a methodology to tackle them
    • Monitor the improvement over a 3–6 month period

Examples, not packages—every engagement is scoped to you and priced on the value it delivers, not the time it takes. Prices exclude VAT.

FAQTemplate single-column Answers AI engines get asked. Populates FAQPage JSON-LD. from about.schema.json Docs ↗

Frequently asked questions

What is Wordnerds?

Wordnerds is a Voice of Customer platform that turns what customers say into what organisations do. It analyses feedback from surveys, complaints, reviews and calls, then delivers themed, explainable insight straight into Microsoft Power BI, so everyone in the organisation can act on what customers are saying, not just the insight team.

Who founded Wordnerds?

Wordnerds was founded by Pete Daykin, Steve Erdal and Angela Daykin. It grew out of a December 2015 innovation challenge set by Nissan, which Pete and Steve won by combining brand-new AI with old-school linguistics to find car-quality issues hidden in social media. Pete closed his agency, and Wordnerds was incorporated in 2017. Today Pete is Chief Executive Officer, Steve is Chief Scientific Officer and Ange is Chief Financial Officer.

Where is Wordnerds based?

We're based in Newcastle, in the North East of England. We're a UK-first company and work with organisations across UK regulated sectors (including social housing, transport, utilities and financial services) where auditable, evidence-backed insight matters.

How big is the Wordnerds team?

We're a team of 23, spanning data science, engineering, product, insight and innovation, customer success, account management, operations and marketing. We're deliberately tight-knit: customers consistently tell us the people are the best part of working with us.

Is Wordnerds an established company?

Yes. The idea was born in a December 2015 Nissan challenge, we incorporated in 2017, came through the COVID years with our customers intact (a "cockroach startup", as someone once dubbed us), and closed a £1.6m funding round in August 2024 to keep investing in the platform and the team.

What are Wordnerds' values?

Five, and we try to actually live them: learn, experiment and change; own your impact; move the metrics that matter; make a connection; and challenge because you care. In practice that means evidence over opinions, a high quality bar, genuine warmth with customers, and an open-book culture where the best idea wins.

FAQTemplate two-column Answers AI engines get asked. Populates FAQPage JSON-LD. from pricing.schema.json Docs ↗

Pricing questions, answered

How much does Wordnerds cost?

Wordnerds pricing starts at £26,400 a year for Starter (25,000 feedback items, single-channel), £43,200 for Pro (150,000 items, multi-channel, plus two custom dashboards), and from £49,800 for Enterprise (unlimited items, fully customised dashboards, omni-channel with CRM and contact-centre data). Pricing is set by data volume and customisation, not per user. All prices exclude VAT.

What's the difference between Starter, Pro and Enterprise?

It comes down to data volume and customisation. Starter suits a single channel like surveys (25,000 items a year). Pro handles growing, multi-channel programmes (150,000 items) and adds two custom dashboard pages. Enterprise covers large omni-channel programmes with CRM and contact-centre data—unlimited items, fully customised dashboards and long-form response analysis.

What happens if we exceed our data limit?

We'll have a conversation—the platform won't cut you off mid-analysis. If you're consistently over your limit, we'll talk about moving to the next tier. We'd rather find the right fit than penalise you for getting more value out of your feedback.

Can we upgrade or downgrade later?

Yes. If your needs change—more channels, more data, or a different level of customisation—we'll adjust your plan. You're not locked into the tier you start on, and you won't need to start a fresh procurement to move.

What does the Customer Success Manager do?

Your dedicated UK-based Customer Success Manager knows your business and your goals. They run regular check-ins to make sure you're getting value, and they own adoption—so the platform gets used and drives decisions rather than gathering dust. They're a proactive partner, not a helpdesk ticket.

How is a subscription different from the proof-of-concept?

A proof-of-concept is a one-off project that proves the value on your data. A subscription is continuous access for your team to train themes, explore data and build reports themselves. If you've done a proof-of-concept with us, your platform is already set up—so subscription value starts immediately.

What if we don't have the resource to run it ourselves?

Training and your Customer Success Manager build your team's confidence and capability over time. And if you'd rather we ran the analysis and reporting for you, our Nerd-assisted consultancy is the done-for-you route—the same insight, delivered by our analysts. Book a diagnostic and we'll work out which fits.

How much does a proof-of-concept cost?

A Wordnerds proof-of-concept starts at £5,775 +VAT for a VoC Benchmark (up to 25,000 feedback items) or £9,600 for a VoC Deep Dive (up to 500,000), with bespoke projects scoped to your question. It runs in about 30 days, and you keep the dashboards, themes and recommendations whether or not you go on to subscribe.

BookDiagnosticTemplate sector-routed The diagnostic-booking section with embedded form. from book-a-diagnostic.schema.json Docs ↗

Tell us your sector and book a time

Choose your sector and we'll introduce you to the specialist who knows it best, then pick a slot that suits you. The whole call takes 30 minutes.

Choose your sector above and we'll show you who you'll be speaking to, along with their calendar.

When you book, your details go straight into our system—we'll only use them to prepare for and follow up on your call. No spam, ever. See our privacy policy for how we handle your data.

FooterCTATemplate yellow Final conversion moment for scroll-through visitors. from about.schema.json Docs ↗

Webinars, blog & stories

WebinarVideoTemplate embedded Privacy-friendly click-to-load YouTube facade for a recording. from awaabs-law.schema.json Docs ↗

Watch the Webinar

Recorded live with around 172 attendees from UK housing associations on 25 September 2025. Duration: 63 minutes.
TranscriptTemplate preview Server-rendered, speaker-labelled webinar transcript. from awaabs-law.schema.json Docs ↗

Full webinar transcript

Steve Erdal: Thank you so much for joining us today. It is lovely to see so many of you — warmest of welcomes from the sunny Northeast. We'll be starting in a minute or so, just letting a few people come in, so please do drop a line in the chat, let us know where you're coming from today and how things are.

Read the full transcript

It looks, from people's messages, like we're getting sunshine from almost everywhere today, which I think is a personal best at a Wordnerds webinar. Normally someone's saying it's very cloudy where they are, so this is great news.

Before we start, we're going to put a poll on your screen. We just wanted to begin by seeing where you are in terms of Awaab's Law — how prepared you're feeling for it, going from "I'm feeling under-prepared" all the way through to "I'm feeling ready for all the phases", because there are three different phases coming in. We'll let that roll for a little while as other people come in.

We've got 172 of you in the audience at the moment, which is very exciting and slightly nerve-wracking, but it's wonderful to have you all here. We've got a lot of people getting ready for next month.

So, warmest of welcomes to what is one of the most-requested webinars we've ever done. We've got a mixture here of long-term customers right through to several of you who I'm sure have never heard of us before, so we thought we'd start with a really quick introduction for any newbies. My name's Steve. I'm one of the co-founders of Wordnerds. I am a recovering linguist, and my role is to work with our customers to ensure they're getting the most out of their customer-feedback data.

We are a customer-feedback platform. We work across a range of different sectors helping organisations automate their customer feedback. We were minding our own business in places like retail and travel and hospitality when housing associations like Town and Country, Guinness Partnership and Sovereign came to us and started saying, "we have this challenge with understanding our customers." Since then, housing has become an area that's very dear to our hearts.

Alongside me today, I'm delighted to welcome two of our finest Wilsons. We have Sarah Wilson, who is our in-house social-housing expert. She's been eating, sleeping and breathing the social sector for several years now, and she'll be taking you through a framework that will allow you to get ahead of Awaab's Law and track hazards individually and collectively. We're then going to hear from Zoe Wilson. Some of the customers on the call will recognise Zoe — she's one of our top customer success managers, and she's been working very closely with the Guinness Partnership on the practicalities of creating a data strategy and developing the data so that you can get the most out of it.

We're super grateful to the Guinness Partnership — I think there are a few of their representatives on the call today. Thank you so much, not just for the work you've done in innovating around Awaab's Law, but also for allowing us to talk about it to everyone here today.

One of the reasons Wordnerds got so involved in social housing is that, amongst all the areas we work in — retail, transport, travel, hospitality — this is an area where the work you do directly impacts people's lives. That's why we love it, and we know how seriously the vast majority of people on this call take that responsibility. In the face of this tragedy, everyone on this call is committed to ensuring that sort of tragedy never happens again. There's an enormous challenge in that, and a lot is being asked of you, but it's also a real opportunity to shape your organisation with the customer at its heart.

I want to stress at the start that we intend this as a dialogue. The truth is no one has all the answers when it comes to Awaab's Law — it's too new, and there are so many ways you can approach it. We're going to show you what the most data-savvy organisations we deal with are doing, but please do use the chat, ask questions, and share your own best practice. We have Vic in the background helping us pick out the most representative questions, and we're committing to answering every question — if we don't get to yours, we'll give an answer in writing.

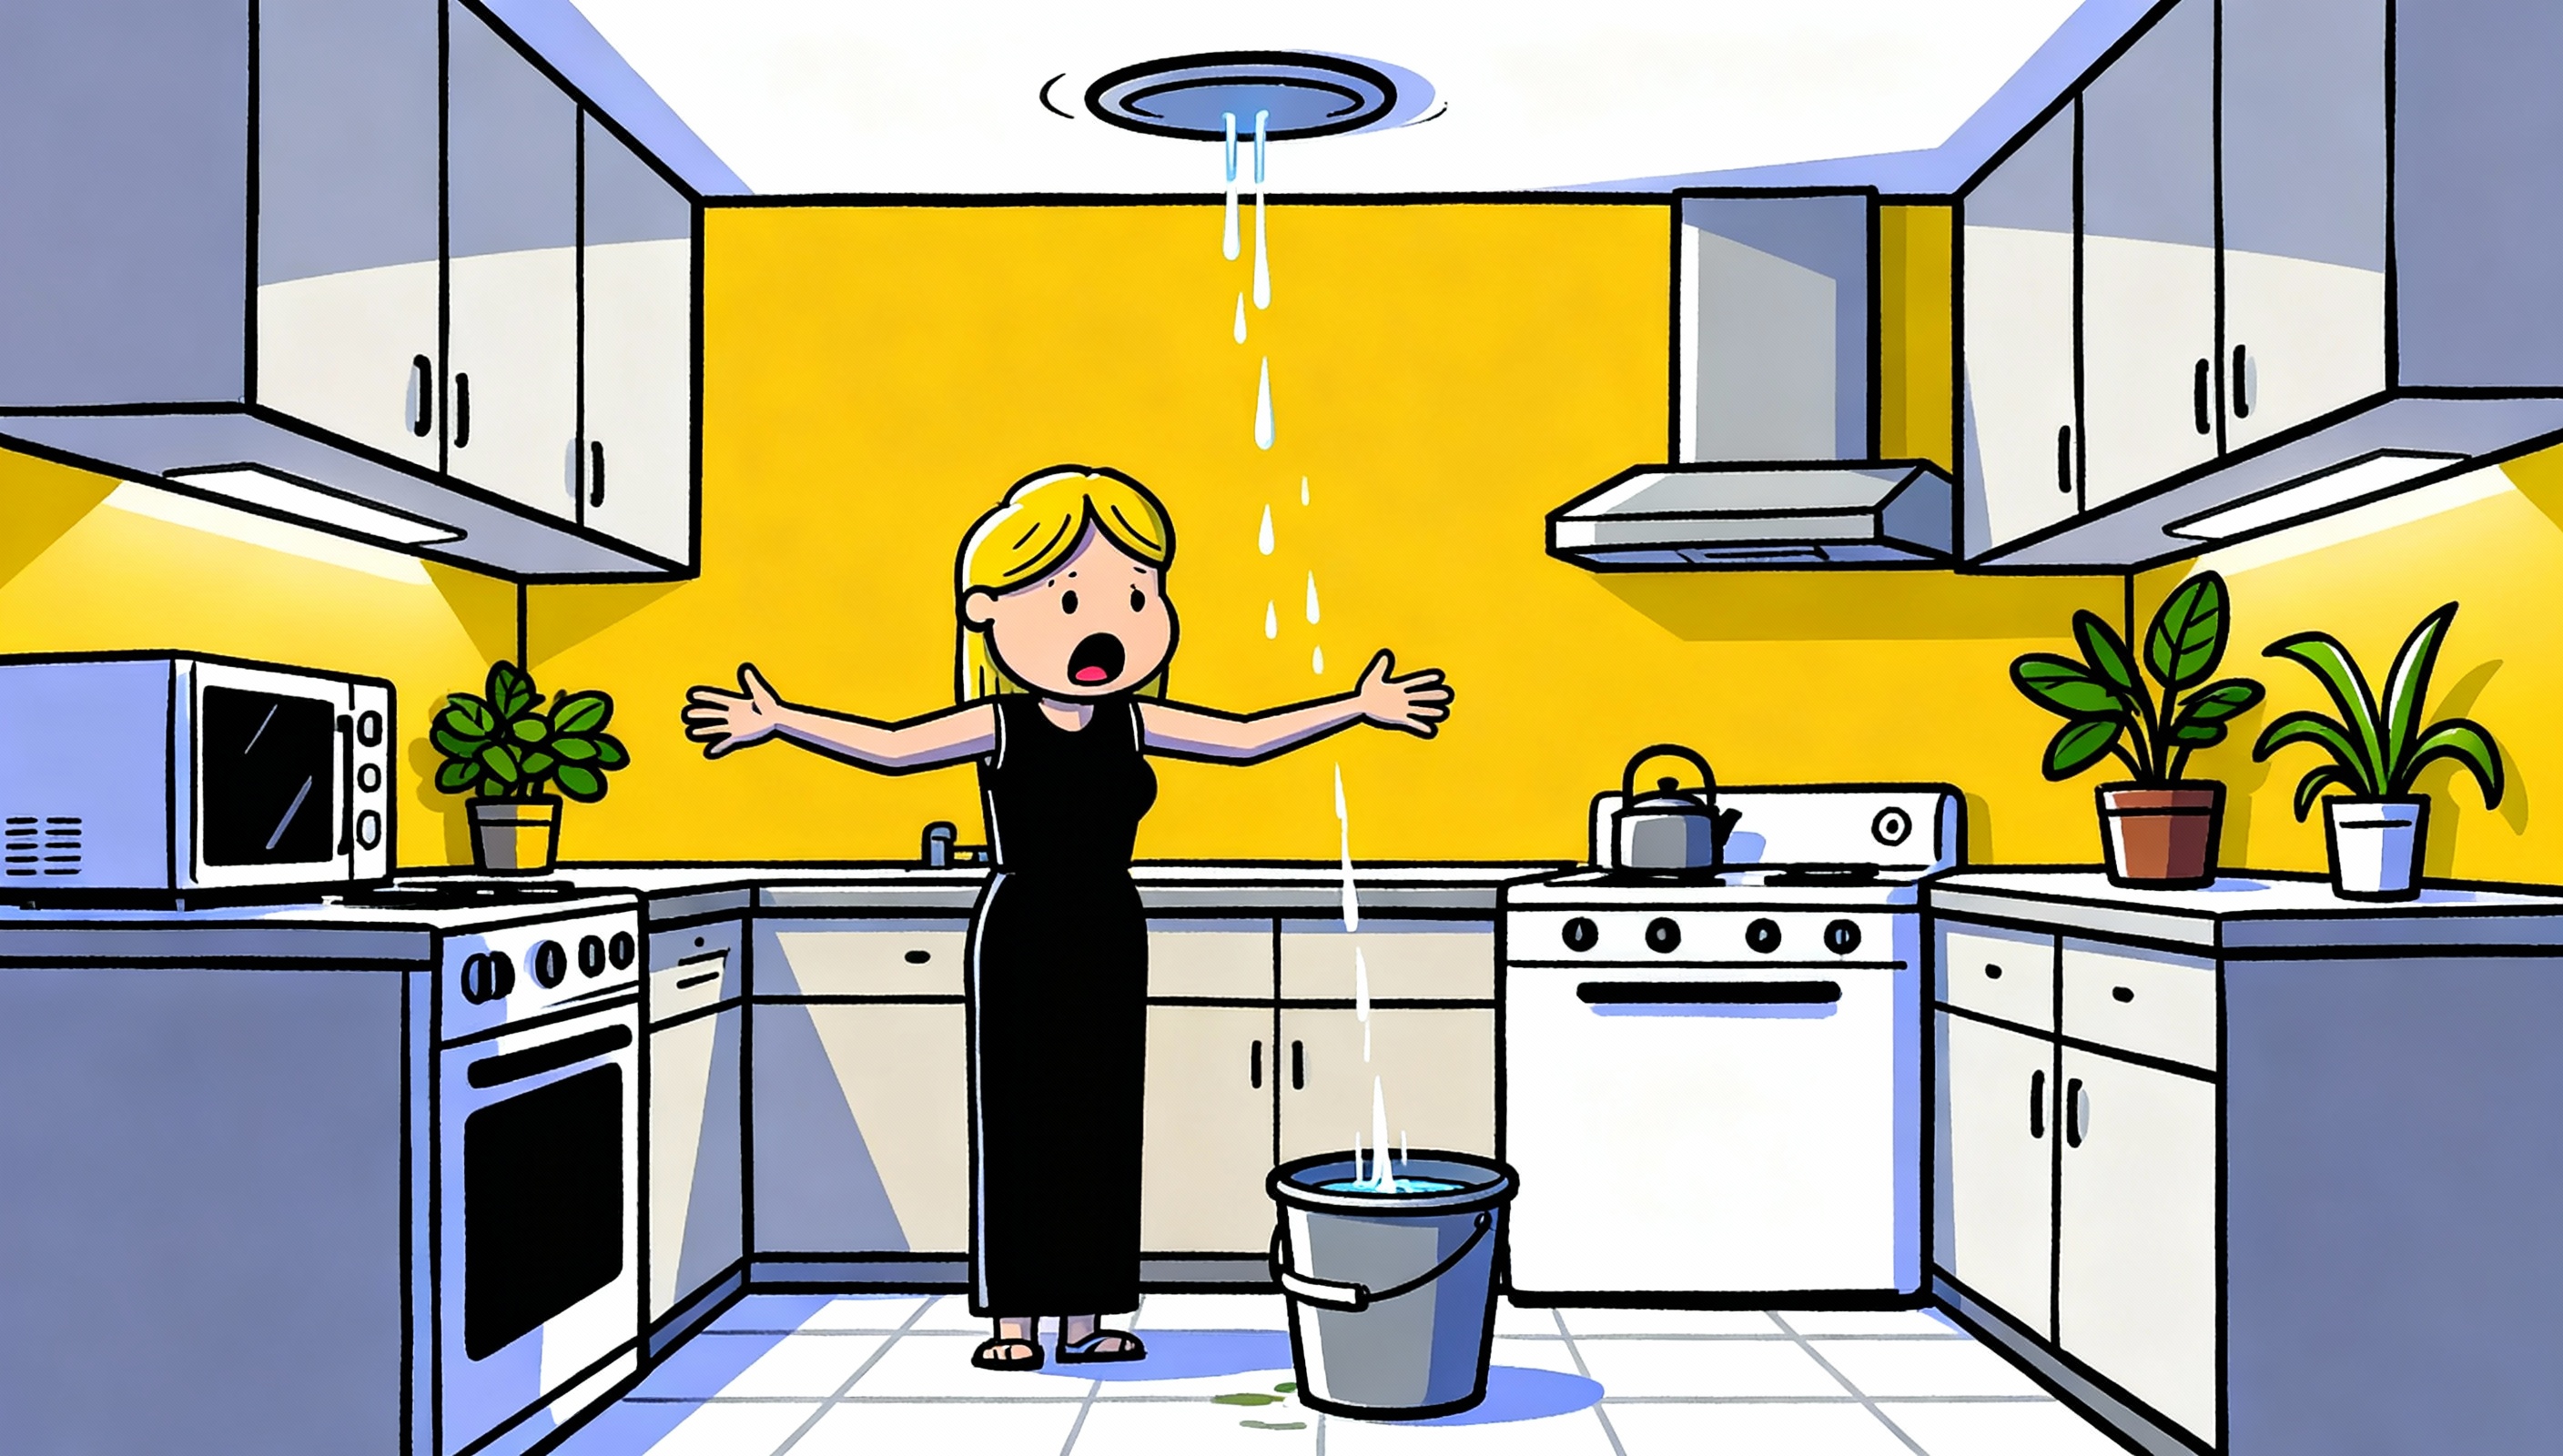
So, in terms of the new law: your legal responsibility is changing, and it will now begin the moment you're told about a potential hazard. You'll be required to make an initial determination as to whether the hazard is potentially significant and whether it could be classed as an emergency. You've then got to assess that risk and take the tenant's personal situation into account — age, health conditions, disability — determine the severity, categorise and triage it, and then report on the solution you came up with.

One of the big shifts is that information must be captured from all communication channels, not just formal complaints. That could be a survey, live chat, a social-media post, a Google review. We always say customers are weird — they'll tell you things in places you wouldn't expect. In the same way you get positive comments in the middle of complaints, you'll also get potential mentions of hazards in places you wouldn't expect. All available information must be used.

So there's an immediate challenge around clear definitions — what does an emergency hazard mean, what does a significant hazard mean? — because those two things trigger different timelines. And you've got to show an effective system for how you're collecting, categorising and prioritising that information. If you're wondering what that rather sad-looking Frankenstein is doing on the screen: we've had this warning from the Ombudsman against landlords simply attaching these new legal duties to existing policies. It's not about having an existing policy and bolting the new HHSRS elements onto it, because that could create — in the words of the Ombudsman — a disjointed and ineffective "Frankenstein procedure". What they're looking for is a comprehensive, well-integrated system.

That challenge affects you regardless of your team. We picked out from the job titles you gave when you joined three main groups. If you're a data and analytics person, your job is to transform that scattered, siloed feedback into an early-warning system — spotting patterns in things like damp and mould, not just counting complaints but identifying which properties need urgent action today. If you're in a customer-experience team, your job is to take that intelligence and turn it into action, seeing where your interventions make the biggest difference to customers' lives — and that's especially true if your team also has some responsibility around contractors, because under the new legislation it doesn't matter whether it's your people or contractors you hire dealing with an issue. And if you're in a business-improvement, strategy or leadership role, your job is to prove that prevention beats cure with hard numbers, building a business case that goes beyond "it's mandatory" to a no-brainer, through the savings in emergency repairs and legal costs.

A couple of final slides on the dates. 27 October 2025 — we have a month and two days — and at that point the categorise-triage-report process is required for any report of damp and mould and all emergency hazards. Throughout 2026 this expands to more hazards: cold and heat, falls, fire and electrical, hygiene and food safety, water supply. And the following year all the phase-one and phase-two hazards, along with all other hazards — light, noise, space and crowding — so that by 2027 there'll be 29 different hazards that need to be triaged and categorised the same way you're working towards for damp and mould right now.

But it's worth saying there's a clear expectation from the Ombudsman that you don't wait — that this is not about doing what's required in 2026 and then expanding in 2027, but looking to extend into other hazards as soon as possible. That's a daunting thing, but again it's also an opportunity. The best housing associations are not using this as a standalone compliance exercise or something to bolt onto existing policies, but as the opportunity for a complete redesign with the customer at its heart. How does one go about doing that? I'm going to pass on to Sarah.

Sarah Wilson: Thanks so much, Steve, that was a really helpful background. What I'm planning to run through this morning is a framework we've developed alongside our housing-association customers, so you can be confident it's built and tested in the real world. There's nothing worse than some abstract framework nobody ever uses.

The core idea comes from Bain & Company — the same people who created the Net Promoter Score. They talk about two loops in the complaint-handling process. When I say "complaint" today, I'm using it in the Ombudsman's sense of an expression of dissatisfaction, however made — so this covers the whole spectrum, from a grumble through to an emergency hazard.

First you have the inner loop. This is what we all spend a lot of time on — the day-to-day resolving of an individual complaint for a specific customer. Someone raises an issue, you fix it, you close the ticket, job done. Then there's the outer loop, which is about stepping back and looking at all the complaints to find trends and patterns, so you can stop these problems happening in the first place. You might be thinking, "we don't really do that" — and if so, you're not alone. I was talking to a head of complaints this week at a 30,000-home association who said he never gets off the hamster wheel to do that strategic overview work. It's very difficult in the day-to-day firefighting.

A best-in-class process closes both loops, and getting to that two-loop approach is what's really going to help meet the Awaab's Law requirements. It's not just best practice anymore — it's essential. The inner loop ensures you meet those tight deadlines for individual cases. The outer loop is where the real transformation happens — it helps you find systemic issues in your properties before they become widespread. The providers really excelling at this don't just track complaints; they categorise all their tenant communications against the HHSRS hazard categories to spot trends early. Instead of just reacting to fires day to day, you can proactively prevent them. That's the real difference between just complying with the law and truly improving tenant safety, which is the heart of Awaab's Law — making sure every family has a safe and healthy place to call home.

Let me break that down. The inner loop is all about speed and accuracy — identifying and fixing individual tenant problems before they escalate. That starts with capturing feedback from absolutely everywhere. Under Awaab's Law, the compliance clock starts ticking the moment a hazard is reported, and it doesn't matter how — a phone call, chat message, email, social-media post, even a casual comment. So many providers have a blind spot here because they only monitor formal complaint channels, and that's a huge risk: by the time the issue is logged formally, you could already be days behind on your compliance time frame.

The second critical step, once you've captured everything, is to categorise it against the framework instantly. This isn't just about finding hazards, it's about confidently ruling out issues too — what's in is just as important as what's out. You simply can't have staff manually reading every message. Most people on this call are using generative AI tools like Copilot and ChatGPT, but that only gets you so far — top-level summarisation. This is where an AI-powered specialist tool designed for the housing sector becomes essential. A good system needs to understand context, not just keywords. A tenant probably won't say "I have damp and mould" — they're much more likely to say "the paint's bubbling on my wall" or "my bathroom is black". The system has to be smart enough to understand these phrases all mean the same thing and signal a potential hazard. Right now the focus is damp, mould and emergency repairs, but a truly effective system is one you can train to recognise all the hazards, so you're ready for the next phases without starting over.

The third part is routing and resolution. Once the system flags a hazard, it has to get to the right team immediately, automatically triggering an alert to your health-and-safety teams with priority flags based on severity. And that's the inner loop done — from identification to categorisation to resolution, ensuring you respond well within those mandated time frames.

We can't just stop there, though. The outer loop is where you take your system to the next level — moving from reactive to truly proactive, preventing problems on a wider scale for everybody. The first step is to identify patterns. Bringing all that data together, you can ask big strategic questions: are we seeing clusters of damp in specific blocks or estates? Do condensation reports always spike in November? Are our 1970s buildings reporting more structural problems than newer ones? There was a really nice example from Guinness about a year ago — damp-and-mould cases were increasing and they weren't sure why, so they did some correlation analysis in the platform and found that people who mentioned plants or ivy were reporting increased instances of damp and mould. They trained a context theme on any botanical mention, used that to put figures on their hunch, and ultimately cleared the ivy and reduced those cases. You'd never see that looking at one case at a time — it's very difficult as a human to pick these patterns out. The outer loop makes the invisible visible.

Once you've got the pattern, the next step is prevention planning — where insight turns into action. If damp is recurring in properties with a certain type of ventilation, that should trigger a property-wide inspection or upgrade programme. If one contractor is constantly being mentioned and causing follow-up repairs, that's a trigger for a quality-control review. The providers nailing this get everyone in a room to review the insights — maintenance, asset management, resident engagement and compliance, all working together to fix the root cause. Even cases where no hazards are reported become valuable data points: knowing your silence helps establish baselines and confirms prevention strategies are working. The final part of the cycle is continuous improvement — setting clear goals like reducing damp reports by 20%, measuring the impact of your fixes, and documenting everything, not just for your own learning but as evidence for the regulator. The most successful providers run quarterly outer-loop reviews where data insights drive strategic maintenance planning, rather than just responding to the loudest voices.

I want to finish by talking about something I don't think is getting enough attention yet: the tenant's right to interrogate your data, which is coming in 2027. That sounds years away, but it'll be here before we know it, and it's a massive shift in transparency. You've got to be ready when a tenant asks "how many damp-and-mould issues have been reported in my building in the last year?" or "which of your neighbourhoods have the highest rates of electrical-safety issues?" These aren't just information requests, they're legal rights now, and you've got to answer them systematically with data broken down by geography and even demographics. For many, this will be a complete rethink of how data is structured — information can't be stuck in departmental silos anymore.

The key to unlocking this is taking advantage of your metadata — and don't let that word scare you, think of it like a tag. You're not just logging the complaint, you're tagging it with property type, building age, location, demographic group and so on. When you consistently tag all this feedback with metadata, you've got a powerful foundation for analysis. This isn't just about being ready for tenants' questions in 2027 — it's about using that exact same data infrastructure right now to find and fix problems before they affect tenants. It turns a compliance tick-box exercise into a strategic advantage. By closing the outer loop, you're not just complying with the law, you're changing how you operate and providing safer homes for all your residents. Back to you, Steve.

Steve Erdal: Brilliant, thank you so much, Sarah. Great point about 2027 being here before we think. In my head, when I hear 2008 my brain still says "wow, five years ago" — so yeah, it will be here before we know it. Thank you for talking us through that framework. If you have any questions for Sarah, we'll do a Q&A at the end, so please do get them coming in on the chat.

So Sarah's talked us through how a framework like that would work. How does it work in practice — how do you turn that into something you can use day to day? Delighted that Zoe's now going to talk us through the work she's been doing with the Guinness Partnership to allow them to do that reporting and triaging across all the different hazards attached to the three phases of Awaab's Law. I'll pass over to Zoe.

Zoe Wilson: Great, thank you, Steve. Very shortly we're going to jump into a live demo using the platform to show how you can use Wordnerds to track these all-important issues from all your different customer-feedback points. To frame this, I'd love to share an example from our customer, the Guinness Partnership. Their insights team are doing really impressive and innovative work with their data and the strategies they implement across the business. As ever, we're really grateful to Chris Haynes, the head of customer insight at Guinness, and the whole team there for generously sharing their approaches with us and with everyone today.

A bit of context on Guinness's approach. While they're still finalising things to be fully compliant, there are a few things in motion. Firstly, like many providers, Guinness send a transactional repairs-satisfaction survey across all trade types, which includes damp and mould. The next step is splitting those damp-and-mould cases out of the whole repairs selection and sending a different survey — less about satisfaction and more about whether the job is complete and whether the customer is confident the problem won't recur. To maximise effectiveness, Guinness are planning to integrate those responses with their CRM, so when a tenant indicates they're not as confident in the resolution as they should be, their case reopens and alerts the assigned case owner. That's helping create a closed-loop system, ensuring persistent issues get immediate attention.

Some of the steps Guinness are focusing on are optimising their data workflow. Their current repair survey includes questions about unaddressed damp and mould; the next step is speeding up the action and response — hopefully using an API to get real-time results from their survey provider, ingesting that data into Microsoft Fabric, which lets them enrich it with property-specific details.

The next part to focus on is how Guinness have built a framework in Wordnerds to track mentions of those Housing Health and Safety Rating System hazards — the HHSRS hazards. They've trained their own classification models using Wordnerds to identify mentions of these specific hazards across their different feedback sources. By using this systematic approach, Guinness have enriched their monthly TSM reporting so they can show hazard-frequency patterns alongside relevant examples from tenant verbatim. So they really see both the quantitative and qualitative insights being used to drive preventative maintenance. The framework is constantly live, always on in Wordnerds, so they can apply it across all their feedback points — not just the TSM survey, but complaints, emails, anything where customers are interacting. The particularly impressive thing is that it's helped position them ahead of the Awaab's Law requirements and raised awareness of recurrent issues. It's a model we're seeing other forward-thinking providers beginning to adopt.

So let's look at that HHSRS hazards framework in more detail. It's not quite as simple as it sounds. The framework contains 29 distinct hazard categories, and the challenge is that these must be consistently identified regardless of how tenants describe them. This is why traditional keyword tagging, or generative-AI systems, isn't really going to work at this scale. Take excess cold — a tenant could describe it in multiple ways. They might say "it's freezing", "it's like a refrigerator in here", or even "I can see my breath indoors". None of these use the word "cold", which exemplifies why keyword tagging isn't enough. Multiply that across all 29 hazards and it becomes near-impossible to manage manually. This is where the AI-powered theme categorisation Sarah introduced becomes essential. If you can train themes to recognise hazards in natural language, you gain confidence you're not going to miss critical mentions, across emails, surveys, social media and call transcripts — creating that safety net that meets the "all available information" requirement.

What I'm going to do now to bring this to life is bring up the Wordnerds platform and show the example of how Guinness have built this out. Before I get started, I just want to flag that what I'm showing today is a demo project. It contains synthesised data from a fictional housing association — there's no real customer data being shown or shared here today.

What you can see now is our theme setup in the platform. A theme is simply a way to group your data in a way that matters to you, creating the distinct categorisations you need to track mentions within your feedback. We've pre-trained some themes on this synthetic dataset based around the HHSRS hazards — 29 distinct themes, one for each hazard. This is just one example of how the platform can track those hazards; it's completely customisable to what you want to listen for. It's also easy to get any text into the platform via CSV upload or an API connection, so you can bring all your different feedback points into one interface to group, interrogate and report on your issues.

Let me show how these themes work, using excess cold. Thinking of the inner loop, we want to create a way to track any mentions where people talk about excess cold — say in an email. This is where the Wordnerds context theme becomes especially powerful: it lets you group conversations where customers are talking about the same issue but using completely different language. The first thing we do is give the system an example of something to include — "my house is freezing" — thinking about how a customer might talk in natural language. The next thing is to establish a boundary between what we do and don't want, so we give it an example of something not relevant — "my freezer is broken" — a similar word used in a completely different context.

The next screen is our theme training screen, where we teach the model what to listen for. Straightaway you can see the results on the right-hand side — these examples are taken directly from my customer verbatim. I'm already getting examples like "draught coming through making it freezing", "cold air". Some might not be quite relevant, but it's doing a pretty good job already. I then go to the training list on the left and simply tag whether each example is or isn't relevant, then click retrain. The more we teach the model, the more it learns what to classify. After training, you start to see all the different ways people reference excess cold — "freezing cold air", "cold spots on external walls", "she's sitting in the cold". Once you're happy, you can apply this across all your data sets — anything in your project, and anything you upload from this point forward, will automatically categorise any mentions, saving all that time and effort.

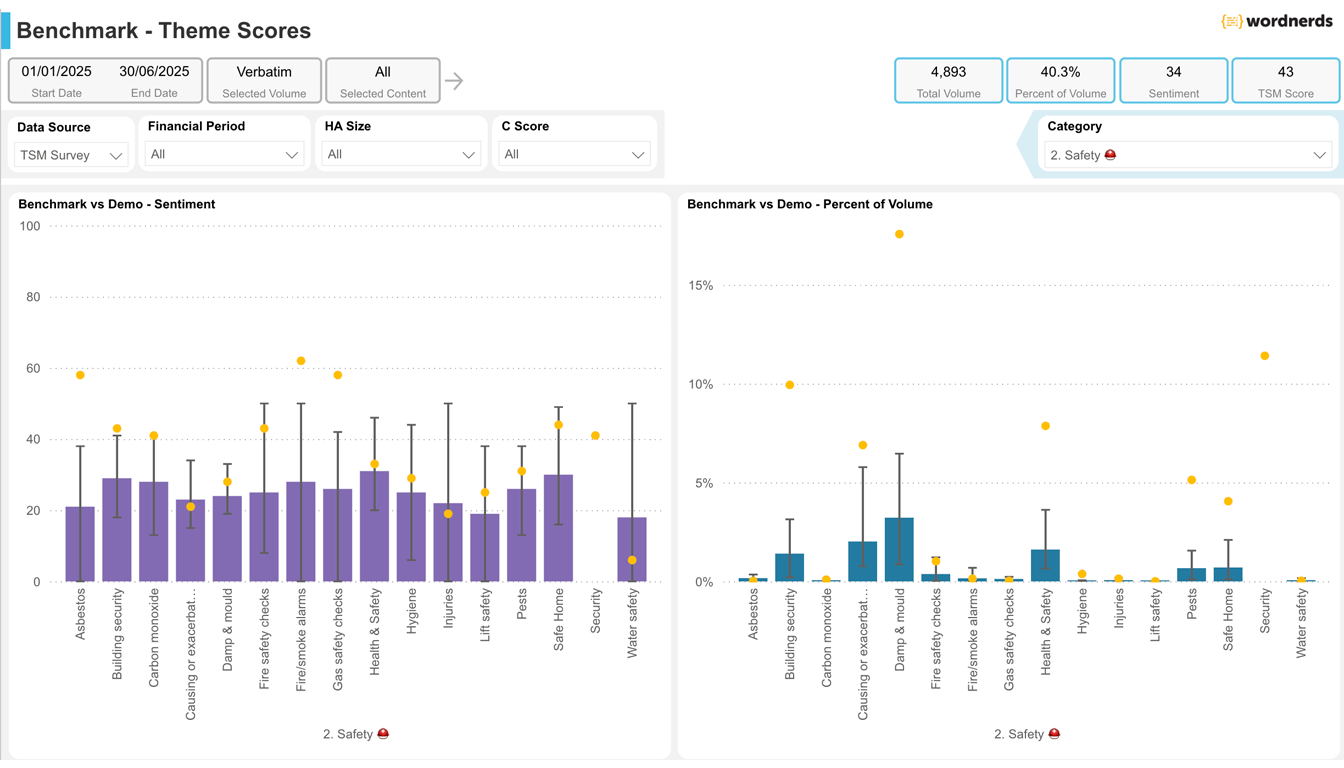
Once that's set up, the next step is the outer loop, understanding these issues at scale. What I'm showing now is a purpose-built housing BI dashboard — an effective way to visualise, interrogate and share your qualitative data so multiple stakeholders can understand how customers are talking about these issues. Everything here is data we've already classified using the Wordnerds themes. First, our hazards framework, showing each hazard and how many times it's been classified. Looking at this data filtered to the first quarter, perhaps unsurprisingly, damp and mould is my most-mentioned hazard with 933 pieces of feedback tagged to this theme. Scrolling down I can see each of the 29 hazards, some at much lower volume — but it's important to have that visibility into what is and isn't being mentioned. Following through with the excess-cold theme, I can see 66 mentions within my feedback.

This dashboard is completely interactive. I can click into the cold theme and the page refilters to show those relevant results, so the slightly crazy line graph with all 29 themes becomes a lot clearer. I can see how mentions have changed over time to understand any peaks across the year. Underneath, you can also see crossover themes — where you use other ways of classifying your data to get into the detail, like a theme around doors or heating crossing over with damp and mould. I can click into a theme and drill through to the direct verbatim — because although we're looking at high-level numbers, the voice of the customer is still super important.

The final bit of the demo shows how to use your metadata to go a step further. The page we're in now is a cross-table, comparing two different elements of your data. I've selected a couple of my hazard themes — excess cold and damp and mould — and chosen to compare them against my different wards, which are just areas in this demo dataset. The cross-table underneath gives significant insight: of all my comments about damp and mould, which areas are they coming from? Using the heat-mapping, at a glance I can see the west area has a far more significant proportion of damp-and-mould comments. That gives me a really targeted starting point to dive in, understand why, and put preventative actions in place. This is just one example — you could present property type, age group, different demographics in these columns, and even cross damp-and-mould-in-the-west with particular property types. So there's so much you can do to get to that outer-loop level and understand your feedback at scale. Hopefully that's been a good overview of what AI-based classification can enable. I'll hand back to Steve to take us through to some questions.

Steve Erdal: Thank you so much, Zoe, that was fascinating. As Zoe said, I want to give as much time as possible for questions, so please keep them coming. It's worth quickly saying that we've covered a lot of ground today and the scale of the change can feel overwhelming. I want to reiterate: you don't have to solve everything at once. Only 2% from that poll at the start said they were fully prepared for all the phases — everyone else is on that journey somewhere. Guinness have taken a lot of steps to get where they are, with Zoe and the Wordnerds team alongside them every step of the way. And the truth is that Awaab's Law does require automation to get to the point you've seen.

So, briefly, what does it look like if you want to get there? The first step is to contact Sarah, our resident housing expert, to talk through what you're currently doing and get a sense of what other associations are doing. You've all met her now — completely no obligation, but her time is finite, so if you'd like to book some time, her calendar is on screen. After that, to get a sense of how your data would look in the framework, we generally suggest a proof of concept: you give us a data dump of your complaint or survey data, we put it through a framework similar to what Zoe just showed, and within about four weeks you receive a workshop, a Power BI file that's useful to you, and a report you can show your team — these are the key issues we're facing, this is what our historic data is telling us. That gives you a benchmark for the triage you're going forward to do. To get the always-on model you saw with Guinness, that starts at around £24,000 a year, ensuring all your data is automatically tagged and passed back to you so you get that triage and categorisation done really quickly, at source, in real time.

Next week you'll receive a wee care package with these slides, the recording, and a guide we put together on Awaab's Law. Our next webinar I'm really excited about, because we're unleashing our data team on you — if you're sick and tired of people talking about AI and want more of what's actually going on under the hood, that'll be a really interesting session with two of our top data scientists. We're also going to be at the Housemark Data Analytics Summit, so please come and say hello — and there's quite an exciting announcement to make there, some more work with Housemark. So watch this space.

Thank you so much for the questions coming in. We've got about 10 to 12 minutes to go through as many as we can. I think it's worth starting with the first one that came in, and Sarah, this is probably one for you — the contractor aspect we talked about, around the fact you're responsible for your contractors' work as well. What can be done to bring third parties on this journey with housing associations?

Sarah Wilson: It's a great question, and one we get quite a lot — especially, as you mentioned, it's going to become even more pertinent. There are a few things we recommend. First, sharing the insights from your analysis: when contractors and third parties see the actual tenant voice and understand the patterns we're identifying, it makes it much more of a partnership relationship. We've got a nice example from Town and Country, which we'll share after the call, where they used the data to improve satisfaction around window cleaning — they noticed people complaining about dirty water being used, fitted some new taps around the blocks, and it was quite a low-cost way of increasing satisfaction.

Using the early-warning system helps too — if you see multiple instances of a ventilation problem, for example, sharing that proactively before it escalates is a good way to bring contractors along. And having shared accountability, with reports and dashboards you can both access, is a good way of handling it. At the end of the day, it's their risk mitigation too — they face reputational damage if they're associated with non-compliance. So making sure nothing falls through the cracks is the best way to handle that.

Steve Erdal: Thank you so much, really interesting. That shared purpose is something we often see — contractors don't necessarily agree with situations, so having that data there is so important.

The next question, and again if we don't get to all of them we'll send answers in writing — probably another one for Sarah. Should info be gathered every time a worker goes into a property — a gas service, an electrical inspection — and should this be treated the same way even if a customer hasn't actually complained about an issue like damp and mould?

Sarah Wilson: Yeah, absolutely. It's not just about responding to complaints specifically. People doing routine visits will often spot some of the early-warning signs we've discussed — damp, mould, condensation problems — before people complain. It's about having that predictive eyes-on-the-data approach. It helps you capture the spirit of the law, not just the box-ticking part of it. So definitely, yes.

Steve Erdal: Absolutely. The first time you're made aware of something can come from any situation, including these initial visits, so having a way of analysing that alongside the surveys and complaints is really important. From the Ombudsman's perspective, there's no difference in terms of how you learned about it — once you've learned about it, that sets the timer off.

I think we've got one here which is probably for Zoe — someone's asked, is the Wordnerds platform suitable for teams who are less technical?

Zoe Wilson: Great question. Short answer is yes. We've created the platform so anyone can jump in, get to know it and use it. We had a couple of our wonderful customers in the chat explaining they can use it in great ways — not that they're not technical, I wouldn't agree with that. And you get really great levels of support from a dedicated CSM in terms of actually being able to use the platform. So it's really easy to pick up and use to analyse your customer feedback. Honestly, if we can use it, then really anyone can.

Steve Erdal: Thank you as well to a couple of our customers who jumped in — Howard and Rebecca, thank you so much. You do yourselves a great disservice, because you do great things with the technology.

I think we have another question here around audio data — can we scan audio, and can that be incorporated from an incoming-calls platform? Zoe, I don't know if you've got anything to say to this — I know you've done some stuff in the past with transcripts of calls, which isn't exactly the same thing.

Zoe Wilson: Yeah, essentially we can work with call transcripts, but the technology doesn't do that transcribing process for you. We do some great things with those transcripts in terms of understanding root cause of issues, and being able to pinpoint things like length of call and how complex the hazards people mention are. So we can totally get that data in, as long as it exists in a text form first.

Steve Erdal: Brilliant, thank you. And with regard to the incoming-calls platform, Philip — it would depend on what that platform was and how we could get the data out of it, whether it transcribes automatically as some do. We'd love to pick that up and talk to you about it further, so do feel free to book some time with Sarah if you'd like to go into that in more detail.

Another really interesting question — about improvement notices. Do you have any examples of improvement notices and what the expected outcomes are, say on excess cold? Sarah, is this one you'd like to take? I could give a few thoughts if not.

Sarah Wilson: I could comment, but yeah, go for it, Steve.

Steve Erdal: In terms of what you're hoping to achieve, we don't have any examples or templates, again because this is so new. As and when we do see what those values will be, we'll definitely be utilising them in the analysis of the data — being able to break the data down by what's expected of improvement notices, in terms of those outcomes. The only thing I'd add is that it's not just about the hazard, it's about the person. As Zoe showed us, you can find areas where there's a particular issue with damp and mould — you can do the same thing with vulnerability. So not just hazard, but vulnerability, and uniting those two things would be a key thing for improvement notices and for the categorisation and triaging. But in terms of improvement notices specifically, please do watch this space — we'll be gathering this information and working to make that better. At the moment there are lots of different approaches and no one knows which one's best yet. Is there anything you'd add, Sarah?

Sarah Wilson: No, I don't think so. Just the capturing of something like cold, which is very hard to capture using keywords. People tend to say "freezing", or "I feel Baltic", or whatever — so just capturing any mention of that is important.

Steve Erdal: We've got an interesting question next, just about the AI aspect. With it being AI, would our data be used to train large language models? Zoe, would you mind speaking to this one?

Zoe Wilson: Yeah, sure. Again, short answer is no. The beauty of Wordnerds is that when you're training your themes, you're training them against your own data. All your data lives in its own project, in its own specific area. So it's not used to train LLMs. And you can get really specific in how you're training your themes based on how your customers are actually talking, specifically because of how that AI is set up. I don't know if there's anything you'd add, Steve.

Steve Erdal: You summed that up beautifully, Zoe — in the interest of time, I'll keep going. Your data does not interact with anyone else's data. It's not used to train any model except the small model that's used to go through your data and find the useful stuff for you.

Next, a request from a resident wanting to know where the most electrical hazards are. That seems like an unlikely request, but in terms of what could be seen as a reasonable request, given there's an unknown volume of them — Sarah, do you have any sense of what might be seen as reasonable here in terms of volume?

Sarah Wilson: It's a really interesting point about volume. For many of these hazards you're only going to see a couple a year. Ensuring you know what's reasonable to expect, in terms of being able to say to residents who want to know where the most likely electrical hazards are — given you might not know the volume — is the challenge. Our response would be: what's the closest you can give them to that information? In terms of unknown volume, it's really hard to get an exact number — an exact number of electrical hazards, an exact number of people suffering from damp and mould — that's a really difficult thing.

The best you can do is have some way of understanding the relative size of it, and the customer-feedback data will tell you that. You might not be able to pinpoint every single electrical hazard through feedback data, but it'll give you a sense of broadly where it's happening and how it compares to other hazards. Relatively speaking, is excess cold a bigger or smaller issue for your association than electrical hazards? The key thing is that it's not reasonable to expect you to know about every single thing. The legislation is clear that it's when you're told about it.

Steve Erdal: When you're told about it, it's expected that you can say "this is the number we've been told about". Is that fair, Sarah?

Sarah Wilson: Yeah, that's fair. And that touches on another question — very aware we're at time now — there's a question around, with the analysis of verbatim, is there a view on whether housing associations will be on notice to undertake an investigation within the prescribed timescales? The answer is yes — as soon as you're made aware, there's a ticking clock. Totally understand that's challenging, but this is why the automatic categorisation comes in. Having that in real time is absolutely crucial, or you're just going to be wading through an impossible volume of requests.

Steve Erdal: Brilliant, thank you so much, Sarah. As you say, we're just beyond time now, so we'll leave it there. We've got so many really interesting questions — we will get in touch with an answer, and we might do an FAQ sheet so we can give everyone the answers we give to those individuals.

Thank you so much — we've had loads of really great questions today. Please keep us informed on what you're doing in this area; we're really keen to learn from you. As with Guinness, we're magpie-ing good ideas here, so please let us know what you're up to. This feels like a stressful and overwhelming time, but for data-savvy organisations this is also an opportunity to do something really powerful for your organisation and your customers. So best of luck, enjoy the sunshine, and we'll see you soon. Thanks so much.

RelatedWebinarsTemplate topic-filter The "see other webinars" cross-link module / listings grid. from webinars.schema.json Docs ↗
BlogPostTemplate article A full blog article body. from cx-corner/why.schema.json Docs ↗
← Back to CX Corner

Why CX Corner exists

And why I'm probably not qualified to write it.

Pete Daykin, Wordnerds' co-founder and CEO, who writes CX Corner
Pete Daykin, Wordnerds' co-founder and CEO.

I know what you're thinking. Another white, middle-class, middle-aged bloke wanging on about his opinions on CX. A thinly veiled attempt to peddle his crappy software. Where do I sign up?

Ah, dear reader. I promise you, this time is different.

You see, I'm not really supposed to be here at all. When I started this journey back in 2017, I knew absolutely nothing about customer experience. Not a thing.

The accidental techy

As a bright-eyed, floppy-haired Gen Xer emerging from the party decade that was the 1990s—a time when everything felt possible and we were all much more innocent (and significantly more drunk)—the plan was to be a football journalist.

And write about football I did. First for my own club, Sunderland, then later getting involved more widely with magazines like FourFourTwo, Total Football, and various newspapers.

But in the early 2000s, I experienced what turned out to be the first technological shift that would turn my world upside down. As football fans became early adopters of the internet, the magazines and newspapers paying my wages started to die. At the same time, football was undergoing its own transformation into a professional industry, and some of the things I loved about my job started to change.

Refusing to admit defeat, I bought a book called Learn HTML in a Weekend and built a very bad website with the hope of replicating the sort of content we were producing—with absolutely no plan at all for how we'd make any money. Within a few weeks, we had 80,000 visitors a week coming to the site.

As we got deeper into the new millennium, I got hooked on this new technology. I got a credit card, bought a suit and a computer, and set up a web design company.

This was new tech. Everybody was making it up. Unaware of my abundant ignorance, I figured I might as well have a go too.

This second chapter of my working life saw me learn sufficiently diligently to bring my communication skills into the digital age. Before long, people were actually buying this stuff, and I needed others to help me. At which point, I was lucky enough to learn how to build a team, demand, a business.

The Nissan challenge

Fast forward to December 2016. Our agency had grown to 26 people, seven-figure turnover, some amazing clients—predominantly up here in the North East of England—when we were invited to take part in a challenge day that Nissan was hosting.

Their challenge? Help them detect problems with cars from people complaining on social media, to shortcut the feedback loop from dealers which took two weeks. When you produce a car every 29 seconds (as Nissan did at that time), that lag time meant 17,000 cars were at risk of all sharing the same problem.

As an experienced digital agency, our instinct was to scan the horizon for software to analyse text and tell a knackered fuel pump from a crap sat-nav driver. And we realised text analytics was not fit for purpose.

Happily, I'd been introduced through one of our software engineers to a rangy linguist by the name of Steve, in a pub a few weeks beforehand. With a head the size of a small meteorite and the brain to match, Steve at the time was working on Victorian ghost literature and experimenting with comparing what universities said about themselves to how they were experienced in the minds of students—which I thought was possibly fascinating and almost certainly useless to human beings.

At the same time, some new technology was coming out of Germany that turned out to be a breakthrough in the world of artificial intelligence. We wondered whether this nascent AI could parse language sufficiently into its constituent elements—verbs, nouns, tense, subject, cause, and the rest.

And despite only knowing me for four and a half pints of his life, Steve stayed up all night, wrote 21 syntactic rules, added three examples of how this might work, and I pitched to Nissan the next morning.

To our shock, horror, and delight, we won the challenge. Nissan gave us £25,000 to build a prototype.

And Wordnerds was born.

The accidental CXer

What started as a side project for the agency in the corner of our office rapidly attracted interest from clients much bigger than we could usually attract as a regional digital agency. It grew and grew until, eventually, it ate the organisation that bore it.

By 2019, we had interest from investors who were able to give us the kind of financial backing required to build a deep-tech company properly—on the condition that we closed the agency.

Steve, our Financial Director Angela, myself, and a small team of engineers and customer-facing people made the jump to Wordnerds full time.

The Wordnerds team celebrating their 2019 funding round
The team celebrating our 2019 funding round.

So my subsequent life in customer experience came about entirely by accident. And I profess to knowing absolutely nothing at all about any of this before we stumbled into feedback analytics through those first few years with clients like Nissan.

As a result—and cognisant of my own enormous stupidity—I made it my business to surround myself with people who know much more about these things than me.

Internally, that meant hiring a wonderful team of talented software engineers, customer experience experts, and supporting cast.

Externally, it meant really listening to first the problems, and subsequently the suggestions, of our wonderful customers who embraced what we were trying to do with such enthusiasm and alacrity, and who have been so generous with their thoughts, ideas, and expertise.

Group photo of the Wordnerds team in 2025
The Wordnerds team, 2025.

What CX Corner actually is

CX Corner is the distillation of all of this.

Sometimes I write about the issues occupying us in the Wordnerds penthouse on the banks of the River Tyne as we navigate the crushing wave of AI and the Gartner hype cycle.

Sometimes I write about the many conversations I have with CX leaders, Voice of Customer managers, industry experts, and any number of people who are somehow connected to the problem of finding out how to improve businesses from the thoughts, reactions, suggestions, and complaints of their customers.

At Wordnerds, we take our work extremely seriously. Ourselves, less so.

We love this world we've stumbled into—and particularly the opportunity it affords us to learn new things every day or week. We're committed to that learning journey above all things, except enjoying the ride along the way, looking after each other, and having bucket loads of fun amongst the very serious aspects of what we do.

I hope that my writing in CX Corner reflects this approach, and that if you sign up, you'll find it informative, interesting, and occasionally amusing enough to look forward to it landing in your inbox every fortnight.

Keep learning!

Pete

BlogPostTemplate article-centred A full blog article body. from blog/wordnerds-housemark-benchmarking-report-2026.schema.json Docs ↗
← All articles
Wordnerds × Housemark

What 135,000 tenant voices revealed: the Wordnerds × Housemark Social Housing Benchmarking Report 2026

We analysed 135,000+ anonymised TSM survey comments from 18 housing associations with Housemark — not the tick-box scores, but the free text tenants write when they have something they actually want to say. On four separate counts, the words told a different story from the boxes.

The Wordnerds × Housemark Social Housing Benchmarking Report 2026 — four findings from 135,000 tenant voices on scores, repairs, effort and safety

Across 135,000 tenant comments, the most dangerous group in your TSM data isn't the one ticking "dissatisfied." It's the one ticking "fairly satisfied"—and writing something that scores 44 out of 100 on sentiment. Wordnerds and Housemark analysed the free-text behind the scores from 18 housing associations, and on four separate counts the words tenants wrote told a different story from the boxes they ticked.

That's the whole point of the benchmark. A TSM score tells you what a tenant selected from five options. It doesn't tell you why, where the risk is concentrated, or what's about to move in the wrong direction. The verbatim does—if you can read it at scale.

What is the Wordnerds × Housemark TSM benchmark?

The Wordnerds × Housemark TSM benchmark is the UK's first qualitative analysis of Tenant Satisfaction Measure free-text comments—135,000+ anonymised responses from 18 volunteer housing associations, collected between January 2023 and mid-2025. Wordnerds turns what customers say into what organisations do: we applied transparent, explainable AI to surface themes, sentiment, journey stages and effort across every comment, then benchmarked the patterns across the sector.

Most TSM benchmarking pools the numbers landlords submit to the Regulator of Social Housing. This one sits underneath those numbers, in the words tenants write to explain their answer. Comments were themed and scored with sector-tuned models, broken down by organisation size, and aggregated so no individual association is identifiable. The output is auditable—every theme traces back to the comments behind it, which is what makes it defensible in a board paper or a regulator conversation.

Why don't TSM scores tell you the whole story?

TSM methodology groups "fairly satisfied" with "very satisfied" as positive responses. The words tell a different story. Across the benchmark, "fairly satisfied" tenants score 44 out of 100 on sentiment—11 points below "very satisfied," but only 10 points above "fairly dissatisfied." By sentiment, they sit closer to your unhappy tenants than your happy ones.

It gets sharper by category. In repairs and communication—the two areas under the most regulatory scrutiny—only "very satisfied" tenants are net-positive on sentiment. The "fairly satisfied" group is, on average, mildly negative. So a landlord reporting 60% overall satisfaction isn't looking at a contented majority. A big slice of that 60% is writing in language that reads as frustration, filed under a score that reads as fine. The comforting average is the most expensive number in your dataset, because it hides the people most likely to leave or escalate.

→ Read the deep dive: TSM vs Sentiment: why 'fairly satisfied' is a red flag

Where does the repair journey actually break?

Not where most teams look. When we mapped tenant comments to the stages of a repair, the cliff edge is the wait—not the work. Booking a repair scores sentiment 45 (TSM 76) across roughly 1,194 comments. Waiting for the appointment scores sentiment 25 (TSM 45) across 3,442 comments—a 20-point sentiment drop, and nearly triple the volume. It's the single lowest-scoring point in the entire journey.

Your contractors aren't the problem. Operative conduct recovers sentiment to 53 once someone turns up—strong work—but it never quite climbs back to where booking started, because the damage was done in the silence beforehand. A tenant who knows the appointment is next Wednesday can plan their week. A tenant who hears "someone will be in touch" spends a fortnight re-juggling childcare and work, and writes "I gave up chasing them." That's not dissatisfaction; it's disengagement, and it's a different problem to fix.

→ Read the deep dive: Your repair scores aren't stuck because of bad contractors

What are tenants measuring that you aren't?

Effort. There's no TSM question for it, but 16.2% of tenants—one in six—describe putting in unnecessary effort to get something sorted. When we categorised that effort, it split four ways: time-based (55%), cognitive (27%), emotional (26%) and physical (4%). A single comment can carry more than one, which is why they overlap.

More than half of it is about time—not complexity, not having to make a trip, just time. And the most damaging form is time spent in limbo, waiting without knowing. The encouraging part is that time-based effort is also the most operationally fixable: you can't easily remove a tenant's anxiety, but you can give them a date and a text when it changes. The drivers bear this out—quick response (+41.15) and reliable service (+40.58) are the two biggest positive movers of TSM scores in the whole benchmark. Tenants don't need you to be faster so much as clearer.

→ Read the deep dive: Stop chasing satisfaction. Start measuring effort.

Why is safety the finding that should worry you most?

Because it's binary. Most tenants never mention safety—if their home feels secure, it doesn't cross their mind. But when one does raise it, satisfaction doesn't dip, it collapses. Security issues are the single largest negative driver in the benchmark: around 36 points off the TSM score. That nearly cancels out the biggest positive driver you have.

Damp and mould lives inside that category. It's 4.9% of comment volume, but where it appears the numbers are stark—sentiment 23, TSM 36 against a sector average of 64—and it rarely travels alone. Tenants writing about mould frequently mention health in the same breath: asthma, a child's chest, breathing. Under Awaab's Law, that comment isn't just feedback—it's a hazard report, and the clock starts whatever channel it arrives through, including a free-text survey box. If your process only flags comments containing the word "mould," you're missing the ones that say "the walls are always wet." This is exactly the kind of signal you cannot afford to read manually, three months late.

→ Read the deep dive: You're not ignoring tenant safety. You're just finding out too late.

What do these findings mean for housing CX leaders?

One thread runs through all four: the score is the headline, the verbatim is the story, and only the story tells you what to do. "Fairly satisfied" looks like a safe baseline until you read it. A decent repairs score looks like success until you stage the journey. No effort question means no visible problem—until one in six tenants tells you anyway. A low count of safety mentions looks like a clean bill of health until you see what each one does to the score.

Reading 135,000 comments by hand isn't an option, which is where we come in—we would say that, wouldn't we. But the principle stands without us: you need the qualitative and the quantitative from one auditable source, so the "what" and the "why" line up and a board can see the evidence behind every priority. That's the difference between walking into your next board meeting guessing, and walking in with the sector benchmark behind every number. Your peers in this dataset can already do that. The question a board will ask is where you sit against them—and "fairly satisfied" is not the answer that makes that question go away.

Cite this research

Wordnerds & Housemark (2026). The Wordnerds × Housemark Social Housing TSM Benchmark. Retrieved from https://wordnerds.ai/blog/wordnerds-housemark-benchmarking-report-2026

Last reviewed 24 June 2026. Next review: 24 September 2026, or on the next benchmark data collection.

BlogPostTemplate article-split A full blog article body. from blog/3-step-framework-for-actionable-qualitative-insights-in-power-bi.schema.json Docs ↗
← All articles

3-Step Framework for Actionable Qualitative Insights in Power BI

Most customer-feedback dashboards describe problems but never drive a decision. Here's the three-step framework we use to turn messy qualitative feedback into Power BI dashboards people actually act on: classification, a semantic model, and visualisation built for action.

Three-step framework for actionable qualitative insights in Power BI: classification, semantic model, visualisation

What makes a customer insight actually actionable?

Qualitative feedback—survey verbatims, complaints, reviews, contact-centre notes—is the richest source you have for understanding what customers actually need. But richness isn't the same as action. An insight is only actionable when it gives a team the fuel and the evidence to change something. From our work with housing associations and other regulated sectors, every genuinely actionable insight has three components:

  1. An obvious next step—it's clear what to do
  2. A measurable result—you'll know whether it worked
  3. A human connection—it's grounded in what real customers said

Miss any one of those and the insight isn't ready for the boardroom or the frontline. Compare these two statements:

The second lands in the boardroom because it carries all three components. The first is just a description. And here's the trap most insight teams fall into: a top-line summary that simply confirms what managers already suspect feels like insight, but it doesn't give anyone enough resolution to act. The themes are right—they're just not specific enough to do anything with. The framework below is how we close that gap, using Power BI as the delivery layer. It comes down to three moves:

  1. Classification—structuring your qualitative data
  2. Building a semantic model—the logic that makes it usable
  3. Visualisation—dashboards designed for action, not admiration

Step 1: Classification — structuring your qualitative data

Before you get anywhere near a dashboard, you have to wrangle the raw feedback—and that starts with classification: grouping comments into meaningful, structured themes. It's where we see the biggest difference between organisations that are insight-led and those that are just reporting numbers.

Most teams start with manual tagging or an inherited taxonomy built around internal departments, process stages, or complaint categories. The problem is that those structures reflect how your organisation works—not how your customers think. Feedback gets forced into boxes that make sense to you and obscure what customers are actually telling you.

What good classification looks like

  • Thematic clarity—each theme represents one idea; no catch-alls, no overlaps.
  • Relevance to action—every theme is something a team can actually do something about.
  • Consistency across sources—the same model works across surveys, complaints, reviews and social, so you're comparing like with like.

Getting this right is partly discipline and partly tooling. It's the job Wordnerds was built for: classifying feedback into themes that emerge from what customers say, rather than from a taxonomy you have to maintain by hand. Once your classification is clear, structured and action-relevant, you can build the logic that powers your reporting—the semantic model.

Step 2: The semantic model — the logic layer Power BI needs

Power BI can't do much with a thousand angry comments about repairs. Classification gives those comments structure—themes, sentiment, topics. The semantic model is what makes that structure usable: it turns classifications into the metrics, aggregations and relationships your dashboards can actually work with.

It's the logic layer that sits between your data and your visuals, and it handles things like:

  • Aggregating sentiment by theme
  • Connecting survey scores to the topics behind them
  • Weighting different feedback sources appropriately

Get the semantic model right and you've built the engine. But an engine isn't a destination—and too many teams treat the dashboard as the end product when it's really the bridge between analysis and action. Build that bridge badly and all the classification and modelling in the world stays locked up where no one can use it.

Step 3: Visualisation — designing dashboards for action

Even a perfect semantic model fails if the dashboard confuses people. We see a lot of dashboards that are beautiful and unusable, because they're built for analysts rather than for the people who have to act. Dashboards that drive action are:

  • Role-specific—a repairs manager needs a different view from a CX lead.
  • Frictionless—under 30 seconds from opening a view to knowing the next step.
  • Context-rich—a chart without the customer quotes behind it won't create the empathy or the confidence to act.

This isn't theoretical. For one housing association, we built a view where a manager clicks "damp and mould" and instantly sees the score, the sentiment, and the actual resident quotes in one place. For a transport client, we set up alerts for when delay complaints spike on specific routes—so operations can act now, not three months later when the quarterly report lands.

Share insight beyond the analyst's desk

Good insight that only the insight team sees doesn't change anything. The point of putting feedback into Power BI is that everyone in the organisation can act on what customers are saying—not just the analysts. A few ways to make that real:

  • Role-specific dashboards for each team—contact centre, repairs, exec.
  • Short Power BI sessions for non-analysts, so people can filter and interpret with confidence.
  • A monthly one-page digest for the teams who'll never open the dashboard.
  • Visibly close the loop—when feedback drives a change, show it, so people keep feeding the system.

Closing the loop: making it stick

Power BI is a powerful delivery layer, but it isn't magic. If your classification is messy, your semantic model isn't set up properly, or your dashboards are built for the wrong audience, the insight won't land—however good the underlying analysis is.

Get the three steps right—Classification → Semantic Model → Visualisation—and you move from reports that describe problems to dashboards that drive action. Add a named owner for each insight and a before-and-after measure, and you've closed the loop: feedback stops being a reporting exercise and starts being a strategic asset.

CustomerStoriesTemplate sector-filter The customer-stories index / related-stories row. from customer-stories.schema.json Docs ↗

Filter by sector, or browse every story.

Other sections

HubSpotFormTemplate centred from c-rating-playbook.schema.json Docs ↗

Register your interest

Tell us a little about your organisation and a housing specialist will pick up the conversation within two working days.

IntegrationsGridTemplate grouped from wordnerds-integrations.schema.json Docs ↗

Every integration, by category

Wordnerds integrates with 26 tools across seven categories: CRM systems, customer-support and contact-centre platforms, survey and feedback tools, review and ratings sites, social media, data and BI tools, and direct data import via API or CSV upload.

CRM Systems

  • Salesforce

    Brings Salesforce customer data and conversations into Wordnerds for theme and sentiment analysis. Enables feedback review within account and lifecycle context.

  • Microsoft Dynamics

    Imports customer data from Microsoft Dynamics for theme and sentiment analysis, helping teams identify feedback themes from organisational data sources.

Customer Support & Contact Centre

  • Zendesk

    Brings Zendesk customer support data into Wordnerds for theme and sentiment analysis, surfacing top drivers of support contact and complaints.

  • Genesys

    Connects Genesys contact-centre interactions and transcripts for theme and sentiment analysis, revealing why customers contact support ranked by volume and sentiment.

Survey and Feedback Tools

  • Qualtrics

    Connects survey responses so Wordnerds analyses open-text comments alongside Qualtrics metrics rather than replacing them.

  • Medallia

    Wordnerds works alongside Medallia, analysing unstructured verbatim to show what's driving collected experience data.

  • SurveyMonkey

    Connects responses so open-text answers are themed and scored, converting free-text into ranked themes and sentiment.

  • SmartSurvey

    Themes and analyses open-text feedback, converting verbatim into prioritised, actionable themes.

  • Customer Thermometer

    Connects responses for automated theme and sentiment analysis, adding reasons behind ratings by analysing comments.

Review & Ratings Platforms

  • Trustpilot

    Connects reviews for automated theme and sentiment analysis, tracking what customers praise and complain about over time.

  • Tripadvisor

    Analyses review text for themes and sentiment at scale, identifying recurring drivers of guest satisfaction and complaint.

  • Google Reviews

    Analyses review text for themes and sentiment at scale, monitoring location and brand-level themes across large volumes.

  • Feefo

    Themes feedback behind scores, explaining what's moving ratings by analysing review verbatim at scale.

  • Bazaarvoice

    Connects ratings and reviews for theme and sentiment analysis, surfacing product- and experience-level themes from review content.

Social Media & Social Listening

  • Facebook

    Facebook posts brought into Wordnerds for theme and sentiment analysis, helping teams see customer brand conversations.

  • Instagram

    Instagram posts and DMs analysed for theme and sentiment, surfacing emerging customer themes from engagement.

  • X

    Conversations analysed for theme and sentiment, helping flag rising customer issues and sentiment shifts.

  • Reddit

    Connects threads and comments for theme and sentiment analysis, capturing unfiltered customer opinion and emerging trends.

  • Brandwatch

    Applies deeper theme and sentiment analysis to social-listening data, turning high-volume mentions into structured, ranked themes.

  • Hootsuite

    Converts social feedback gathered in the platform into customer insight through theme and sentiment analysis.

  • Sprout Social

    Themes and scores social conversations, adding deeper analysis to social data.

Data & BI Tools

Wordnerds delivers themes, sentiment and scores natively into Microsoft Power BI—no manual export or import.

Direct Data Import

No connector for your system? Send data straight in via API or CSV upload.

  • API

    Sends feedback data from unlisted systems into Wordnerds for analysis, letting technical teams import on their own schedule.

  • CSV Upload

    Uploads customer feedback directly into Wordnerds for analysis—getting feedback from any source into the platform in minutes.